GoNoGo Trend Pro
Overview
Expanding on the existing GoNoGo Trend indicator, this tool adds additional Icons.
GoNoGo Charts highlight low-risk opportunities for trend participation and alert investors to short-term countertrend corrections with intuitive icons directly in the price action.
The resurgence of momentum in the direction of the trend is an excellent entry opportunity, or the chance to scale up positions. GoNoGo Icons illuminate these events on the chart with green or red solid circles.
When GoNoGo Trend is painting blue bars, a green solid circle will appear above price each time GoNoGo Oscillator finds support at zero.
When GoNoGo Trend is painting purple bars, a red solid circle will appear each time GoNoGo Oscillator hits resistance at the zero-line from below. Contrarily, within a “Go” trend, a security’s momentum may reach overbought levels, then fall back toward the zero-line.
While in a “NoGo” trend, a security’s momentum may fall to extreme oversold levels, and then cool. As the momentum calculations retreat from extreme overbought or oversold levels, GoNoGo Icons highlight the possible countertrend correction in price.
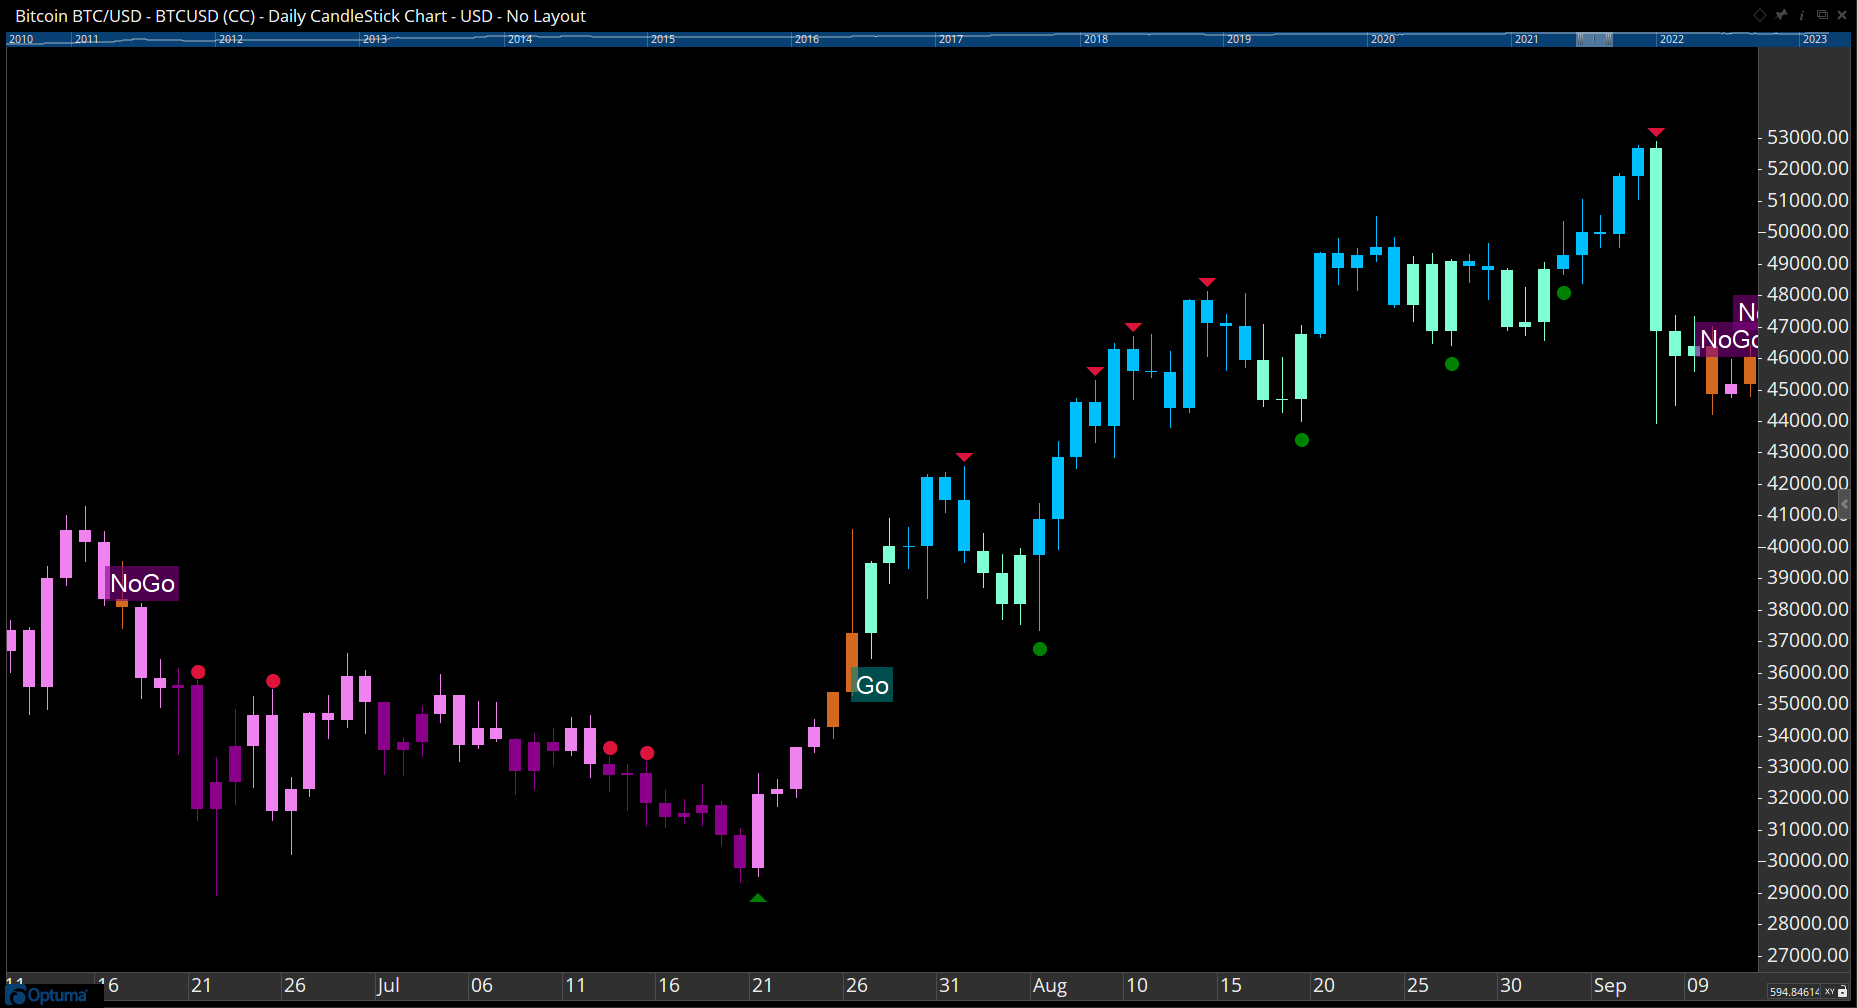
To add the tool to your chart, select the tool from the GoNoGo tool group, and left-click on the chart to add the tool. Optuma will then draw the tool using the default settings. You will see the bars change colour, as well as the addition of Go and NoGo labels and Icons.
Scripting: GNGTRENDPRO()
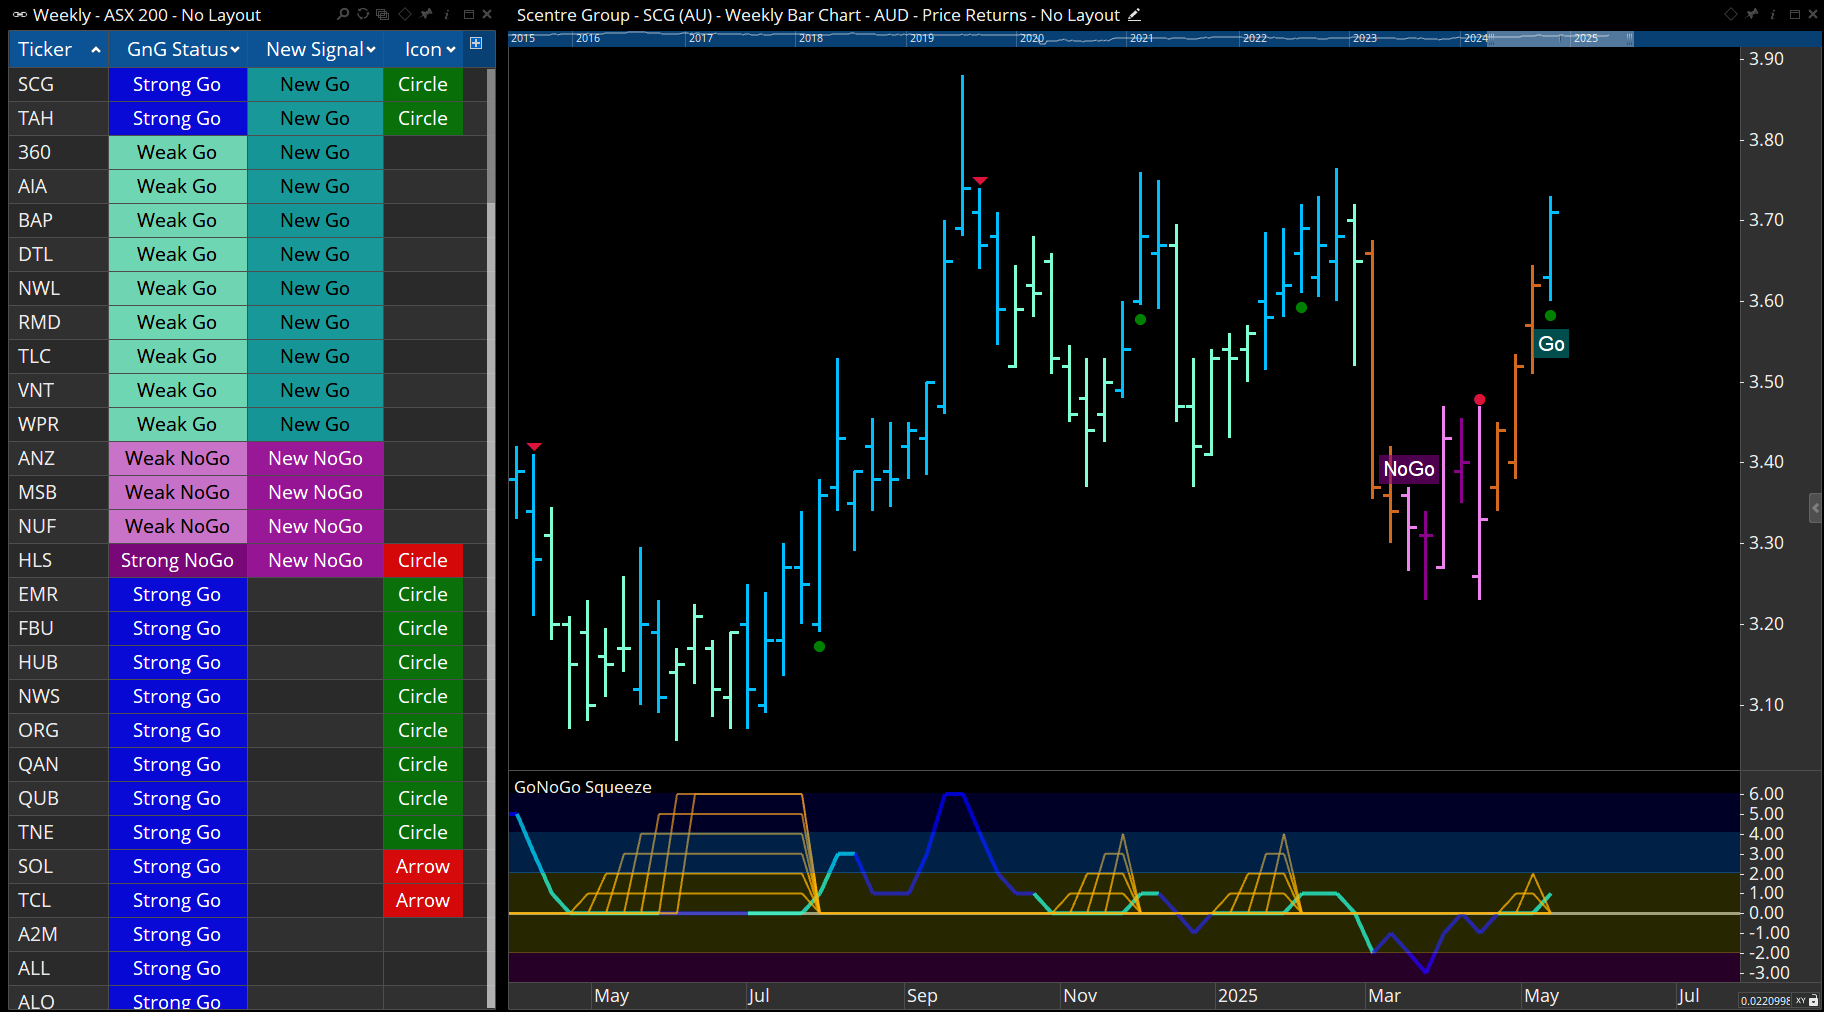
There are lots of outputs for the Trend Pro indicator: one for each colour (Blue, Aqua, Orange, Fucsia, and Purple) and one for each icon (Red Circle, Red Arrow, Green Circle, Green Arrow). The default GNGTRENDPRO() function in a watchlist will automatically label the current status and associated colour (ie blue Strong Go, orange Go Fish, etc). They also have a value associated with them ranging from 0 (Strong NoGo) to 4 (Strong Go):
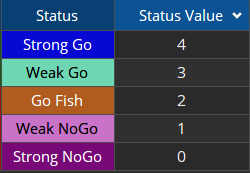
To scan for stocks with a Weak Go (3) or Strong Go (4) status you would use the following:
GNGTRENDPRO().Status > 2
To display the circle and arrow icons in a watchlist:
GNGTRENDPRO().Icons
To scan for green circle icons:
GNGTRENDPRO().GreenCircle
Workbooks
If you have the GoNoGo add-on module enabled on your account, click the links below to download workbooks for a watchlist sorted by new GoNoGo signals, along with the icons and current status:
Actions and Properties
Actions
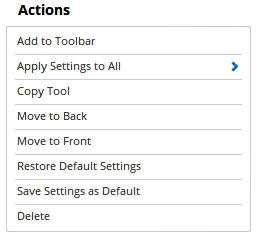
Add to Toolbar: Adds the selected tool to your Custom Toolbar
Apply Settings to All: When multiple GoNoGo Trend tools have been applied to a chart, page or workbook, this action can be used to apply the settings of the one selected to other instances of the tool. This is a great time saver if an adjustment is made to the tool - such as line colour - as this allows all the other GoNoGo Trend Pro tools in the chart, page or entire workbook to be updated instantly.
Copy Tool: Allows you to copy the selected tool, which can then be pasted onto a different chart window.
Move to Back: If the tool is displaying in front of other tools or indicators clicking this action will move the tool view to the background.
Move to Front: If the tool is displaying behind other tools or indicators on the chart, clicking this action will bring the tool to the forefront.
Restore Default Settings: Click this action if you have adjusted the default settings of the tool, and wish to return to the standard properties originally installed with Optuma.
Save Settings as Default: If you have adjusted any of the tool’s properties (colour, for example) you can save the adjustments as your new default setting. Each time you apply a new GoNoGo Trend Pro tool to a chart, the tool will display using the new settings.
Delete: Deletes the tool from the chart.
Properties
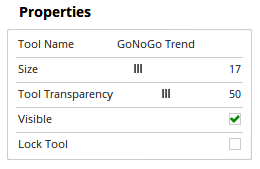
Tool Name: Allows you to adjust the name of the tool, as it’s displayed in the Structure Panel.
Size: Use this slider bar to increase or decrease the size of the Go / NoGo labels and icons appearing on the chart.
Tool Transparency: Use this slider bar to adjust the transparency of the tool. Moving the slider to the left will increase the transparency of the tool.
Visible: Un-tick this checkbox to hide the tool from view.
Lock Tool: When this checkbox is ticked the tool can’t be deleted from the chart and none of the tools properties can be modified.