Optuma is your ultimate solution for advanced financial and technical analysis. Tailored to meet the needs of traders and analysts seeking profesional charting software, Optuma empowers you to excel in the market.
Why choose Optuma?
Effortlessly streamlines and enhances your workflow, simplifying complex tasks
Accelerate your research and trading processes with unparalleled technology
Gain access to a comprehensive suite of advanced charts, indicators, and alerts
Benefit from the number one support team in the industry
Designed to cater to users of all levels
Optuma is built to be your single solution for financial analysis. It’s the go-to program for market professionals ranging from buy and sell-side analysts, portfolio managers, Wall Street departments, and professionally-minded private traders.
“Please excuse my language, but holy crap, Optuma continues to blow me away. Difficult time stringing words together but feature after feature astounds me… i.e., the ability to highlight numerous tools/lines/etc and make it a quick button up top is crazy. Multi-time frame analysis with different periods/averages on the same chart… multi-currency – wow. Flexibility to deal with multiple markets at the same time…. you guys don’t need to give me more reasons to love this thing!”
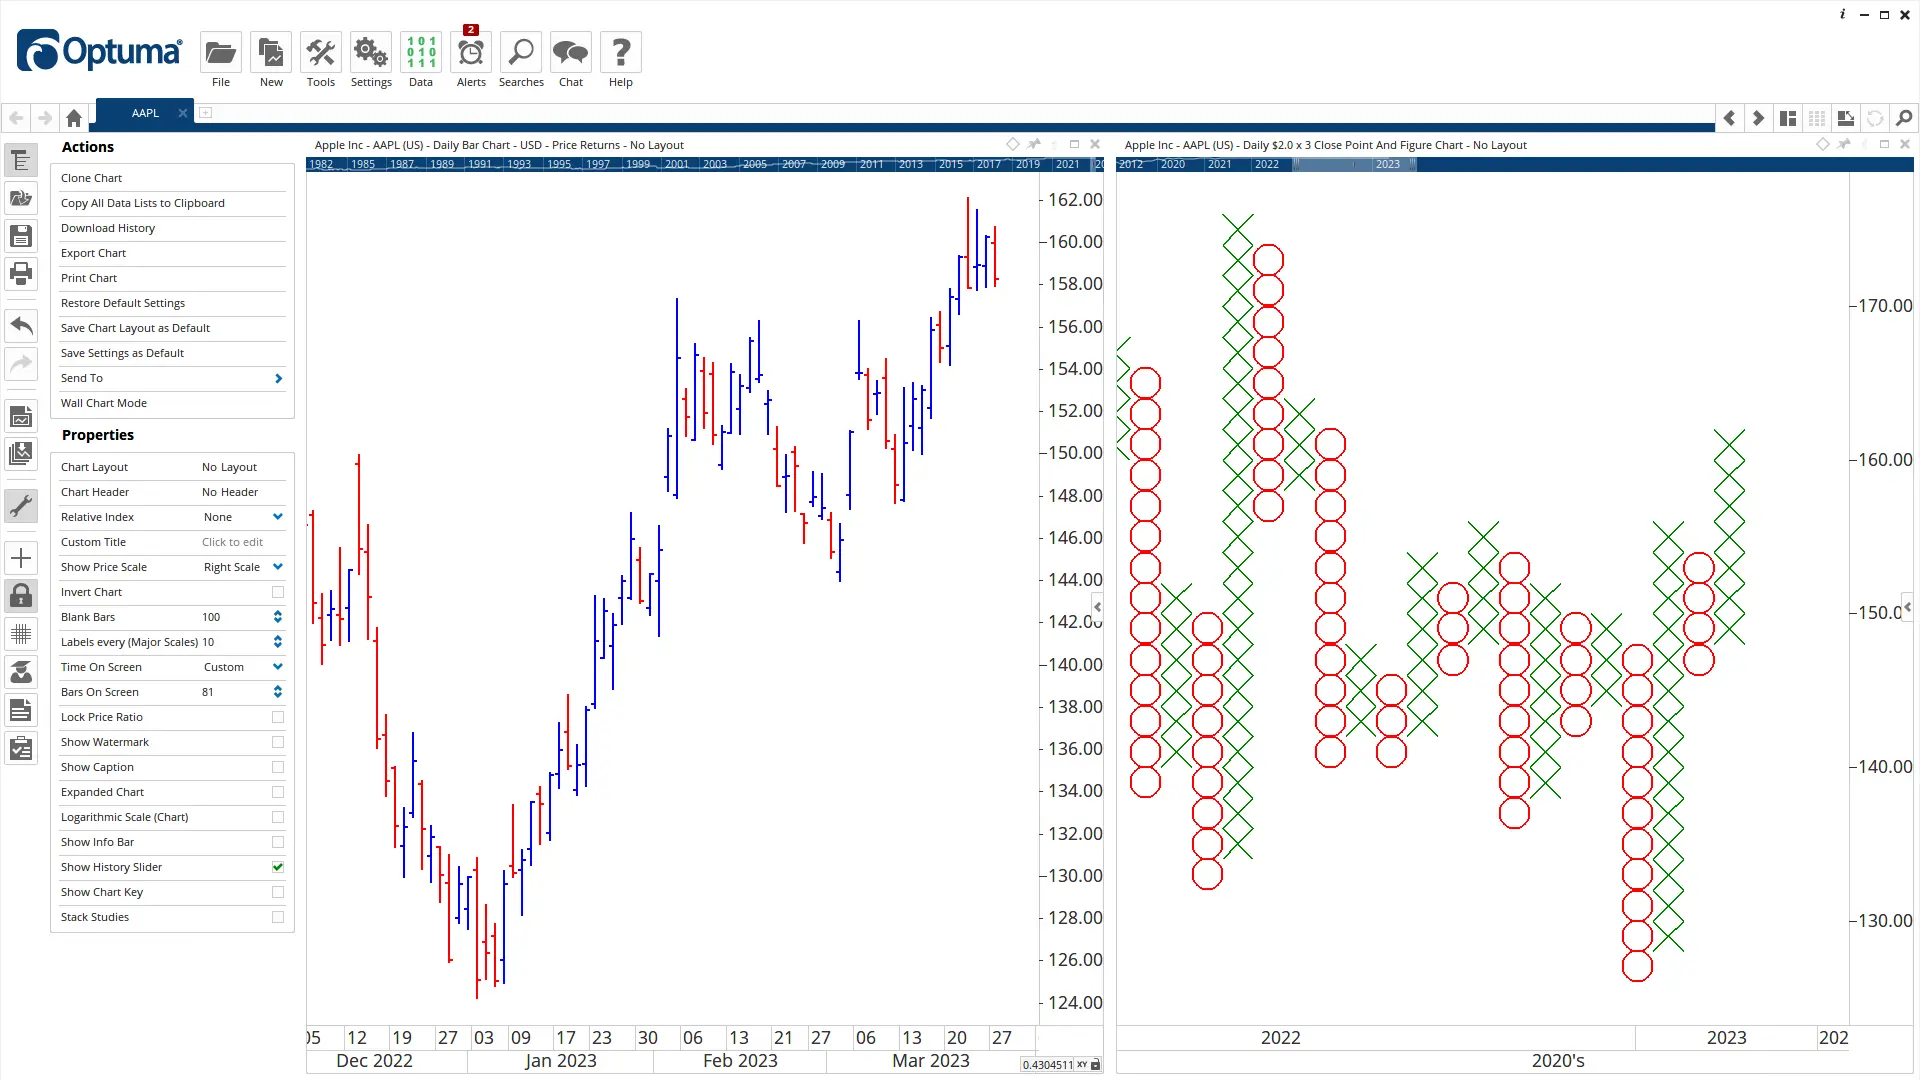
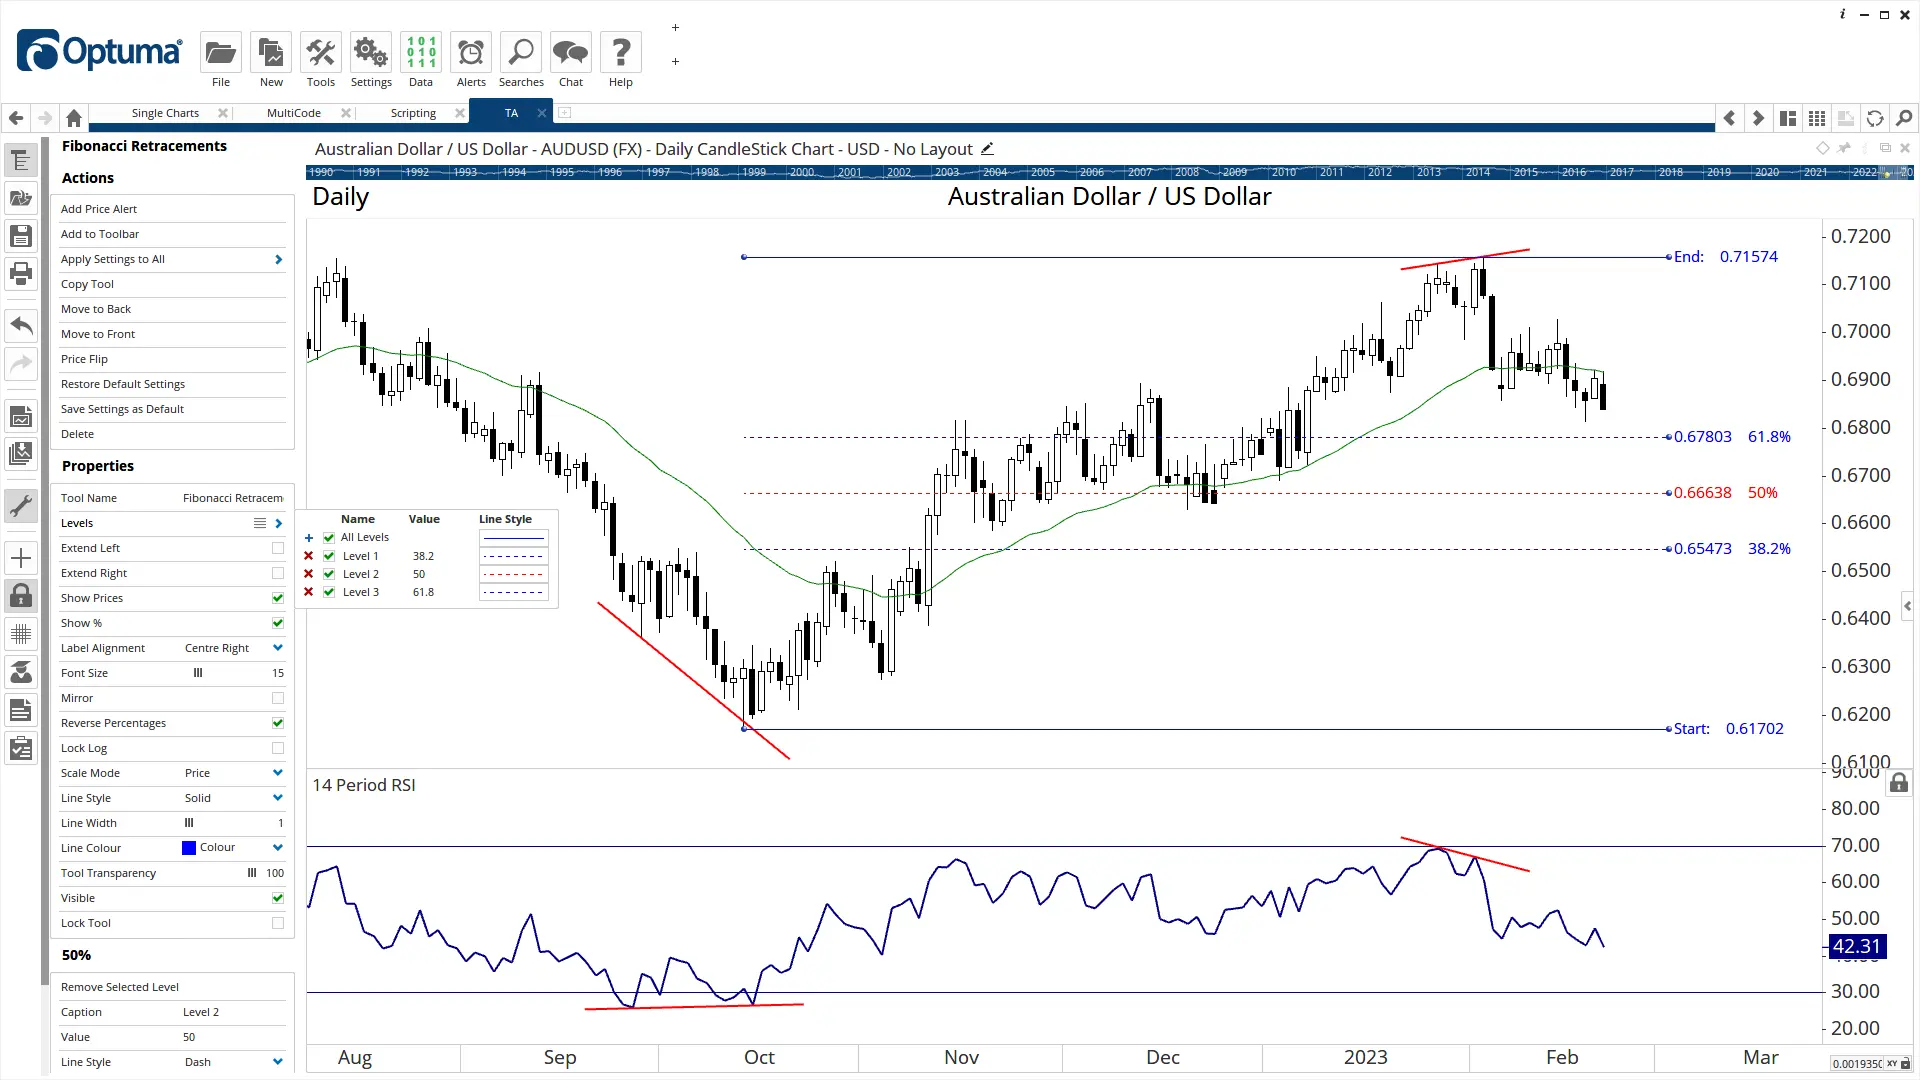
Optuma’s single security charts are designed logically to give you easy control. Adjust the time-frame, view history, and apply indicators to every chart with ease.
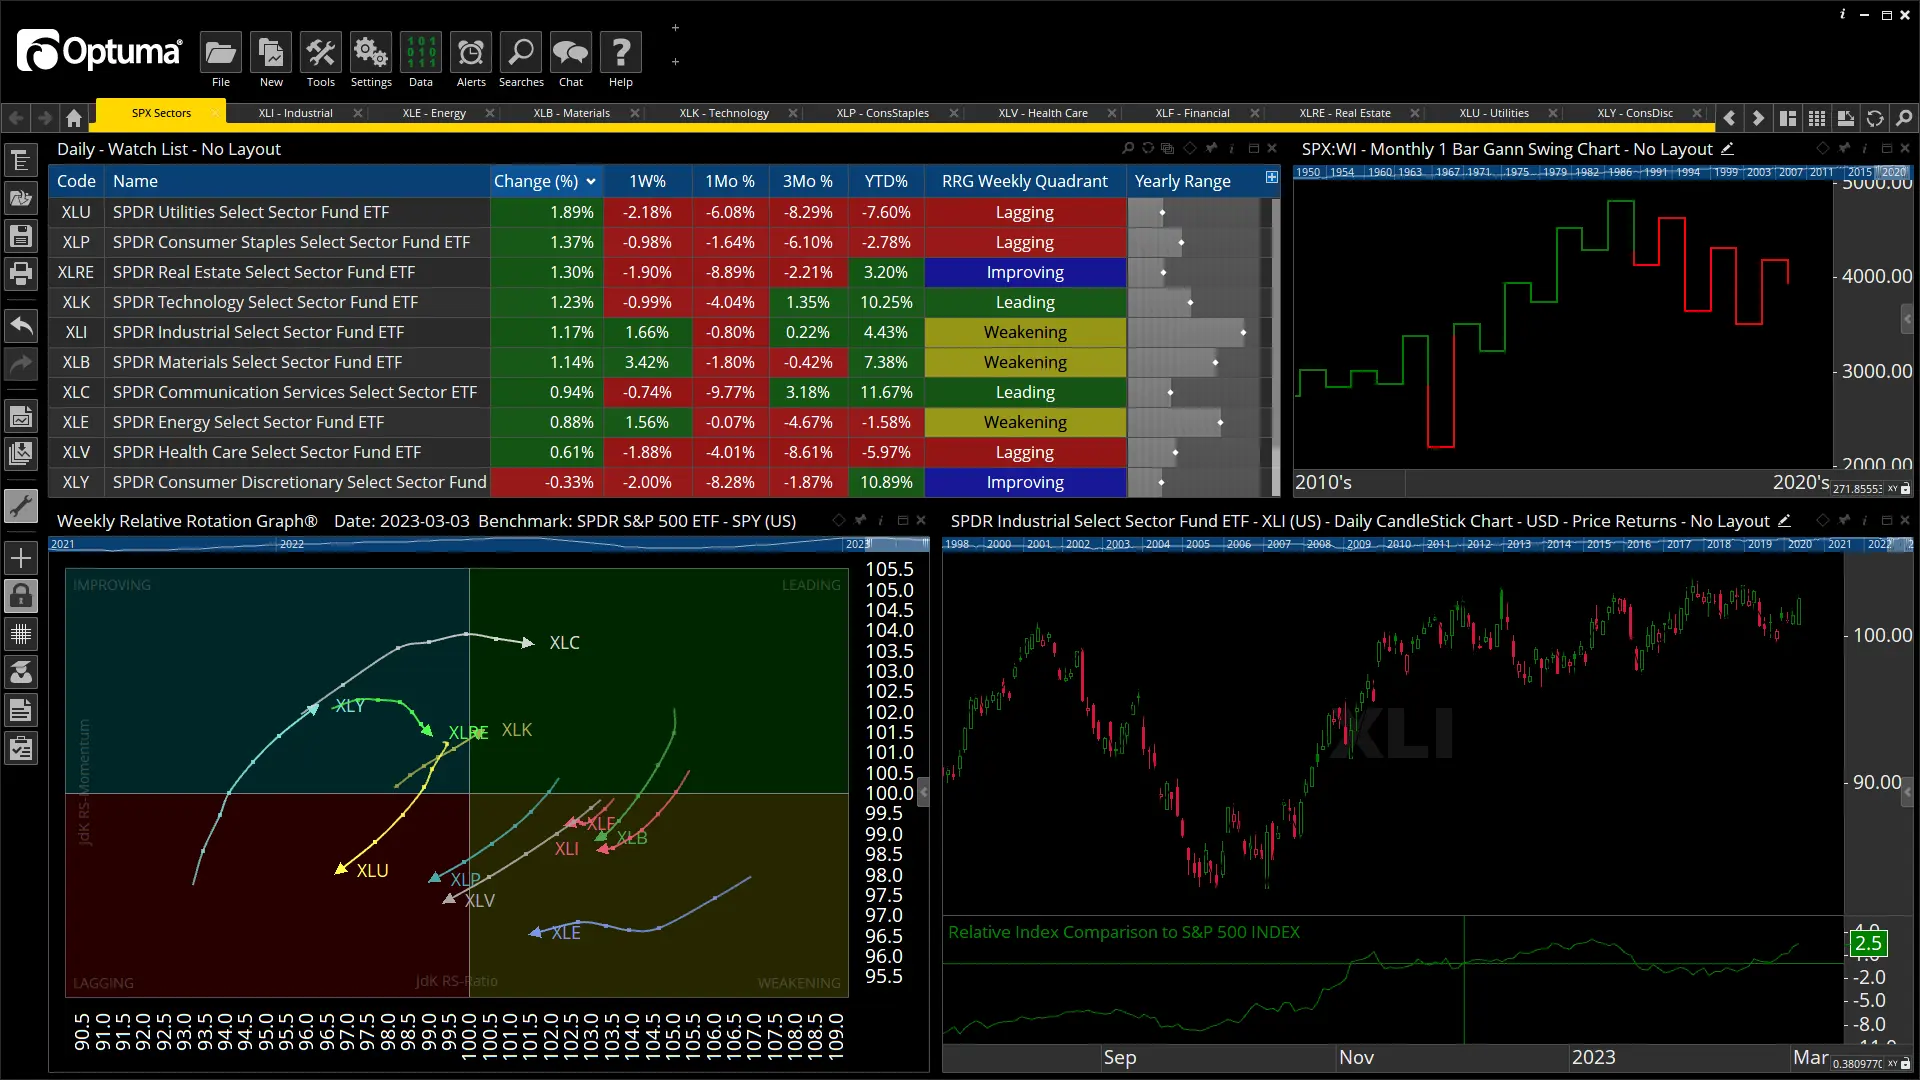
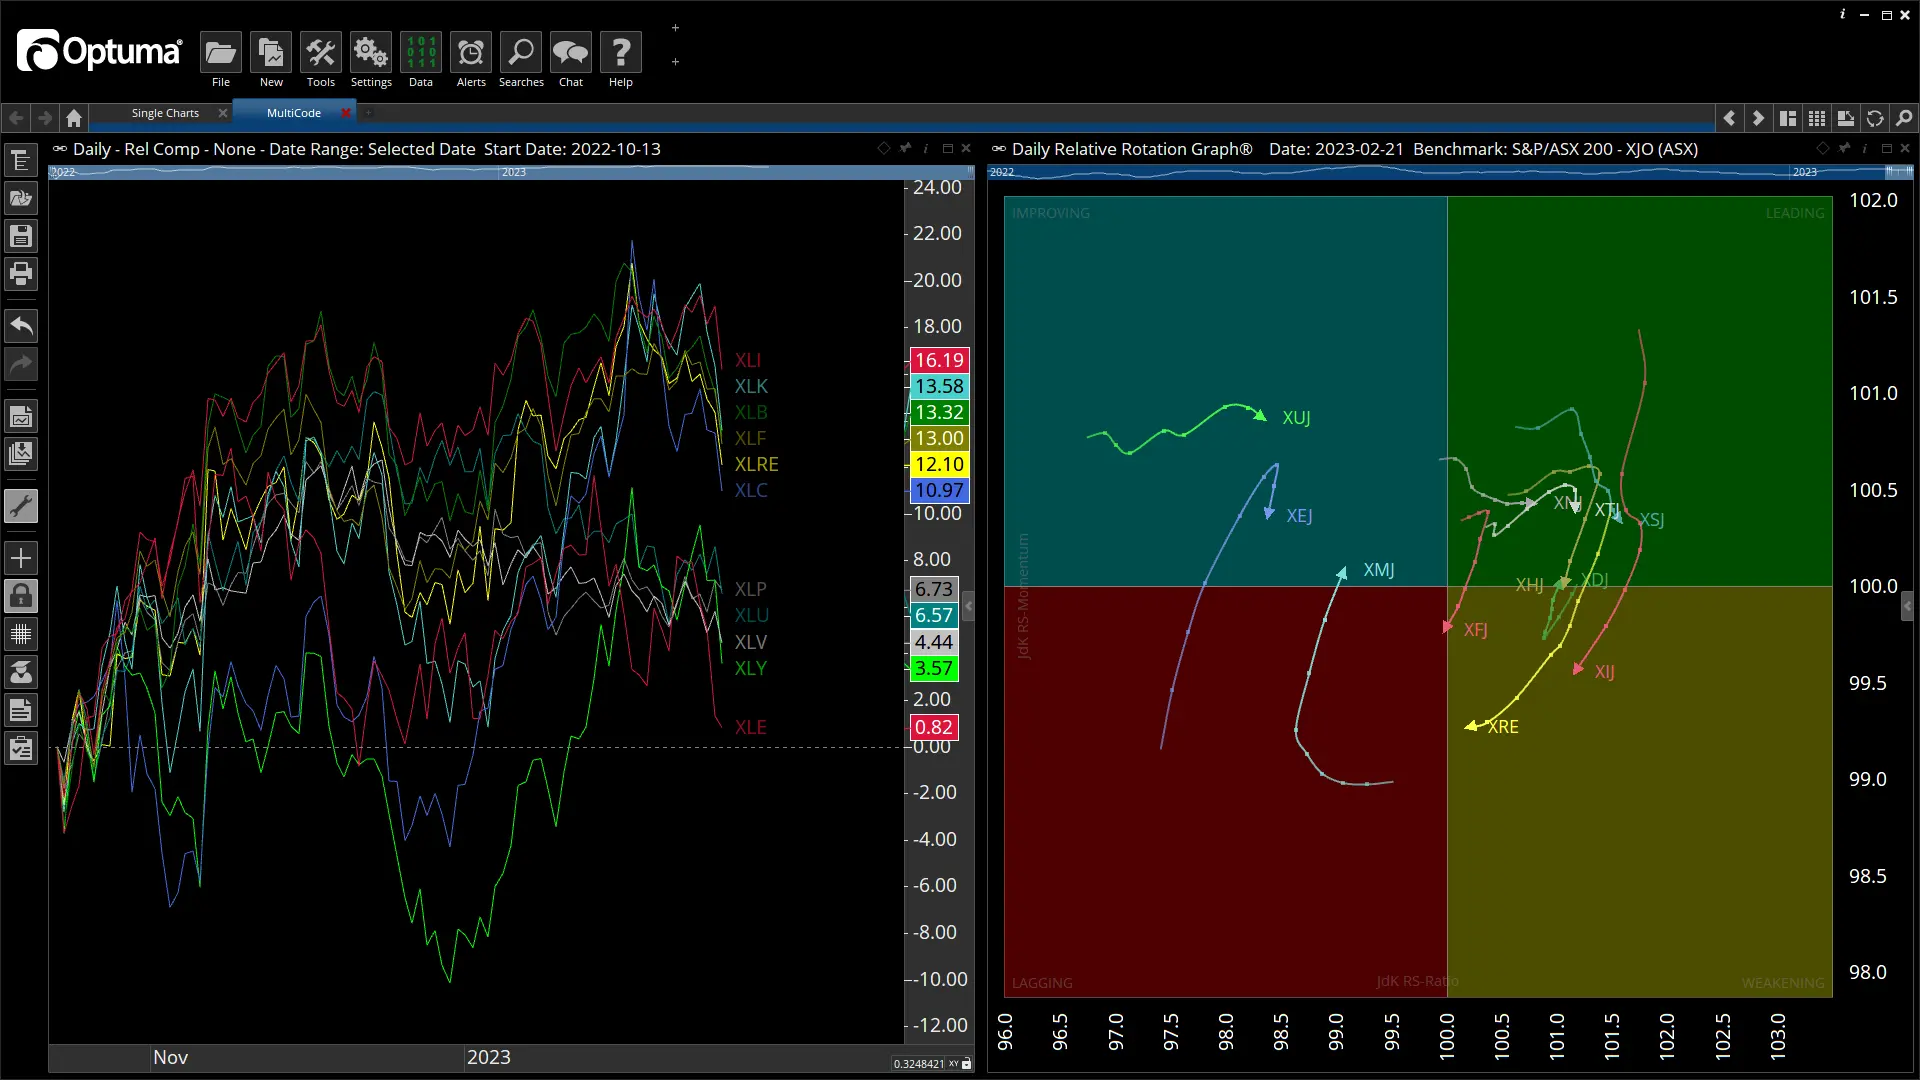
Built to help you review and rank multiple securities. Optuma gives you advanced charts—many not found anywhere else—that basket securities and compare them. These charts allow you to build a dashboard looking more like business intelligence rather than security analysis.
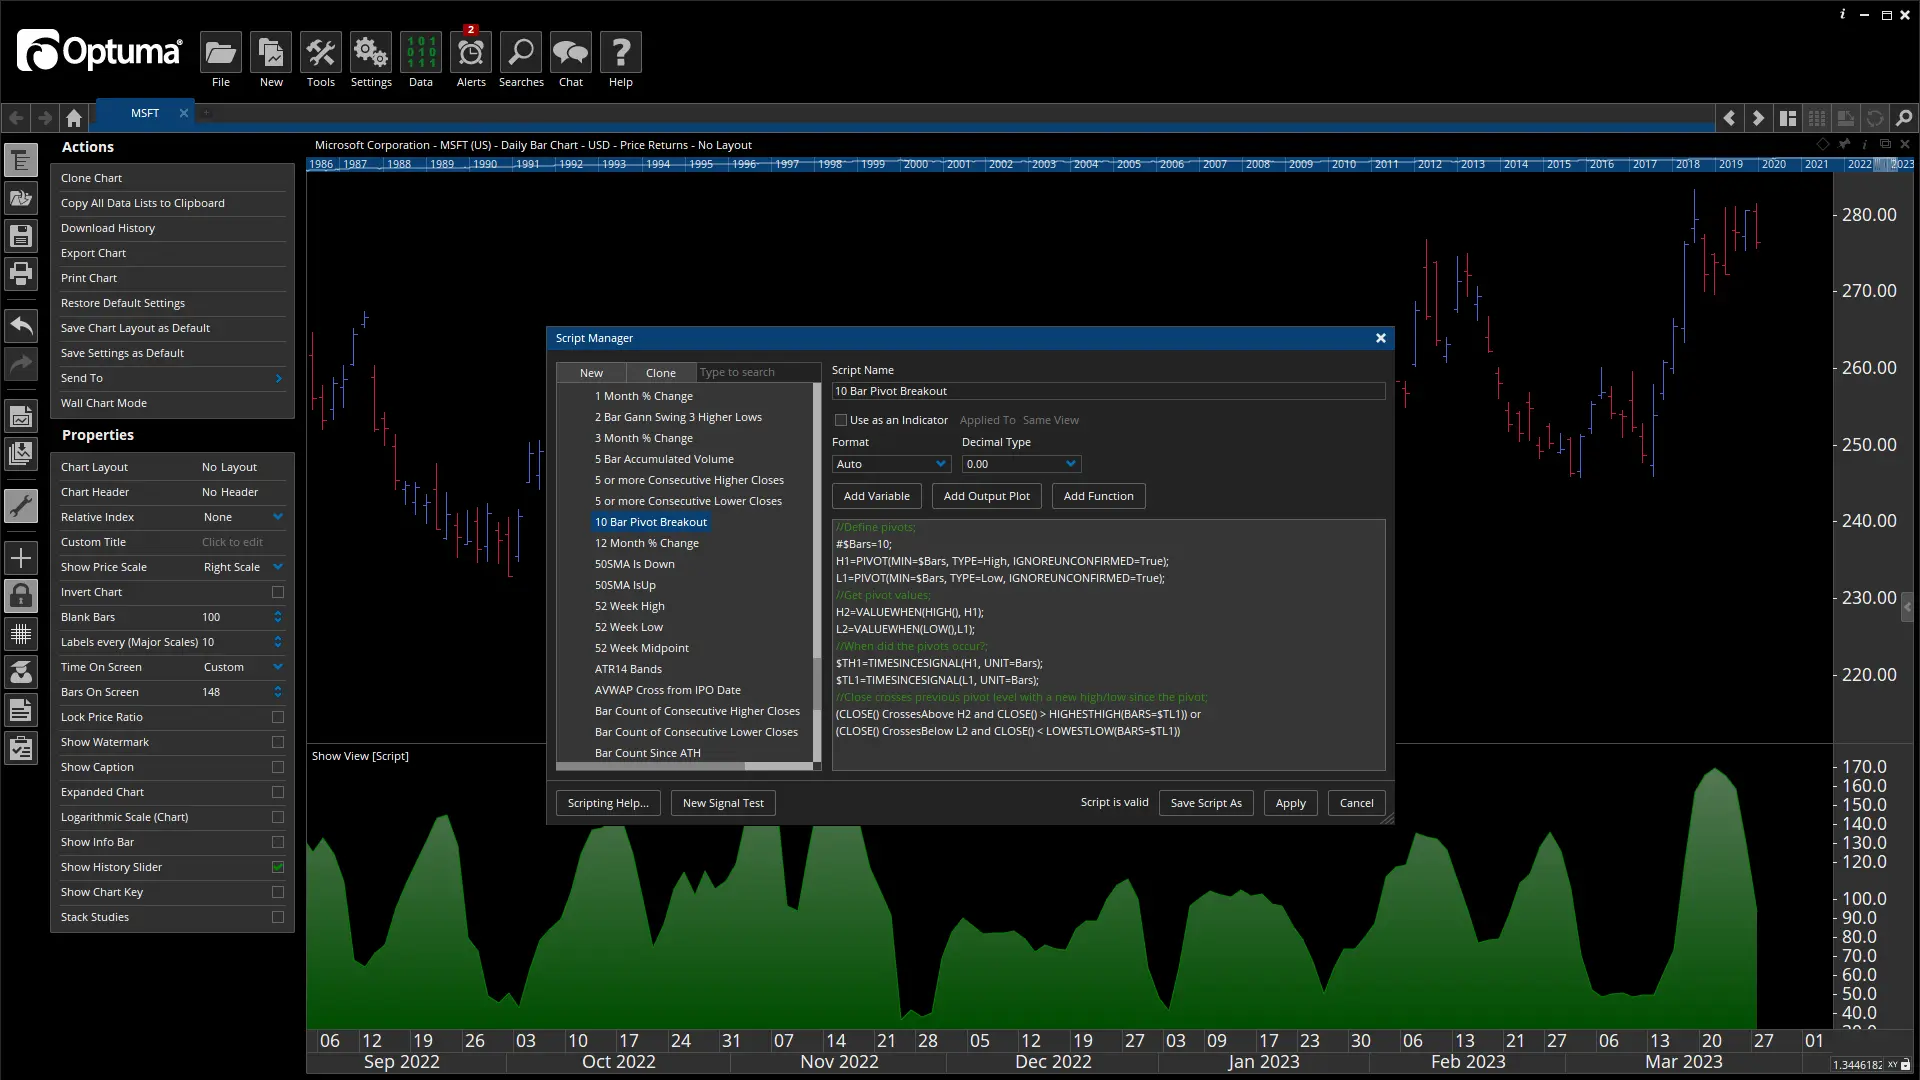
Optuma scripts are built to be as simple as excel formulas, so you don’t need any coding knowledge. Yet they are powerful enough for you to explore any idea.
The premier Technical Analysis software solution built for you.
No matter how you approach the market, Optuma has the most advanced tools for you. Optuma comes with all the standard indicators you would expect. RSI, Stochastics, Averages, Oscillators, MACDs, and a whole lot more.
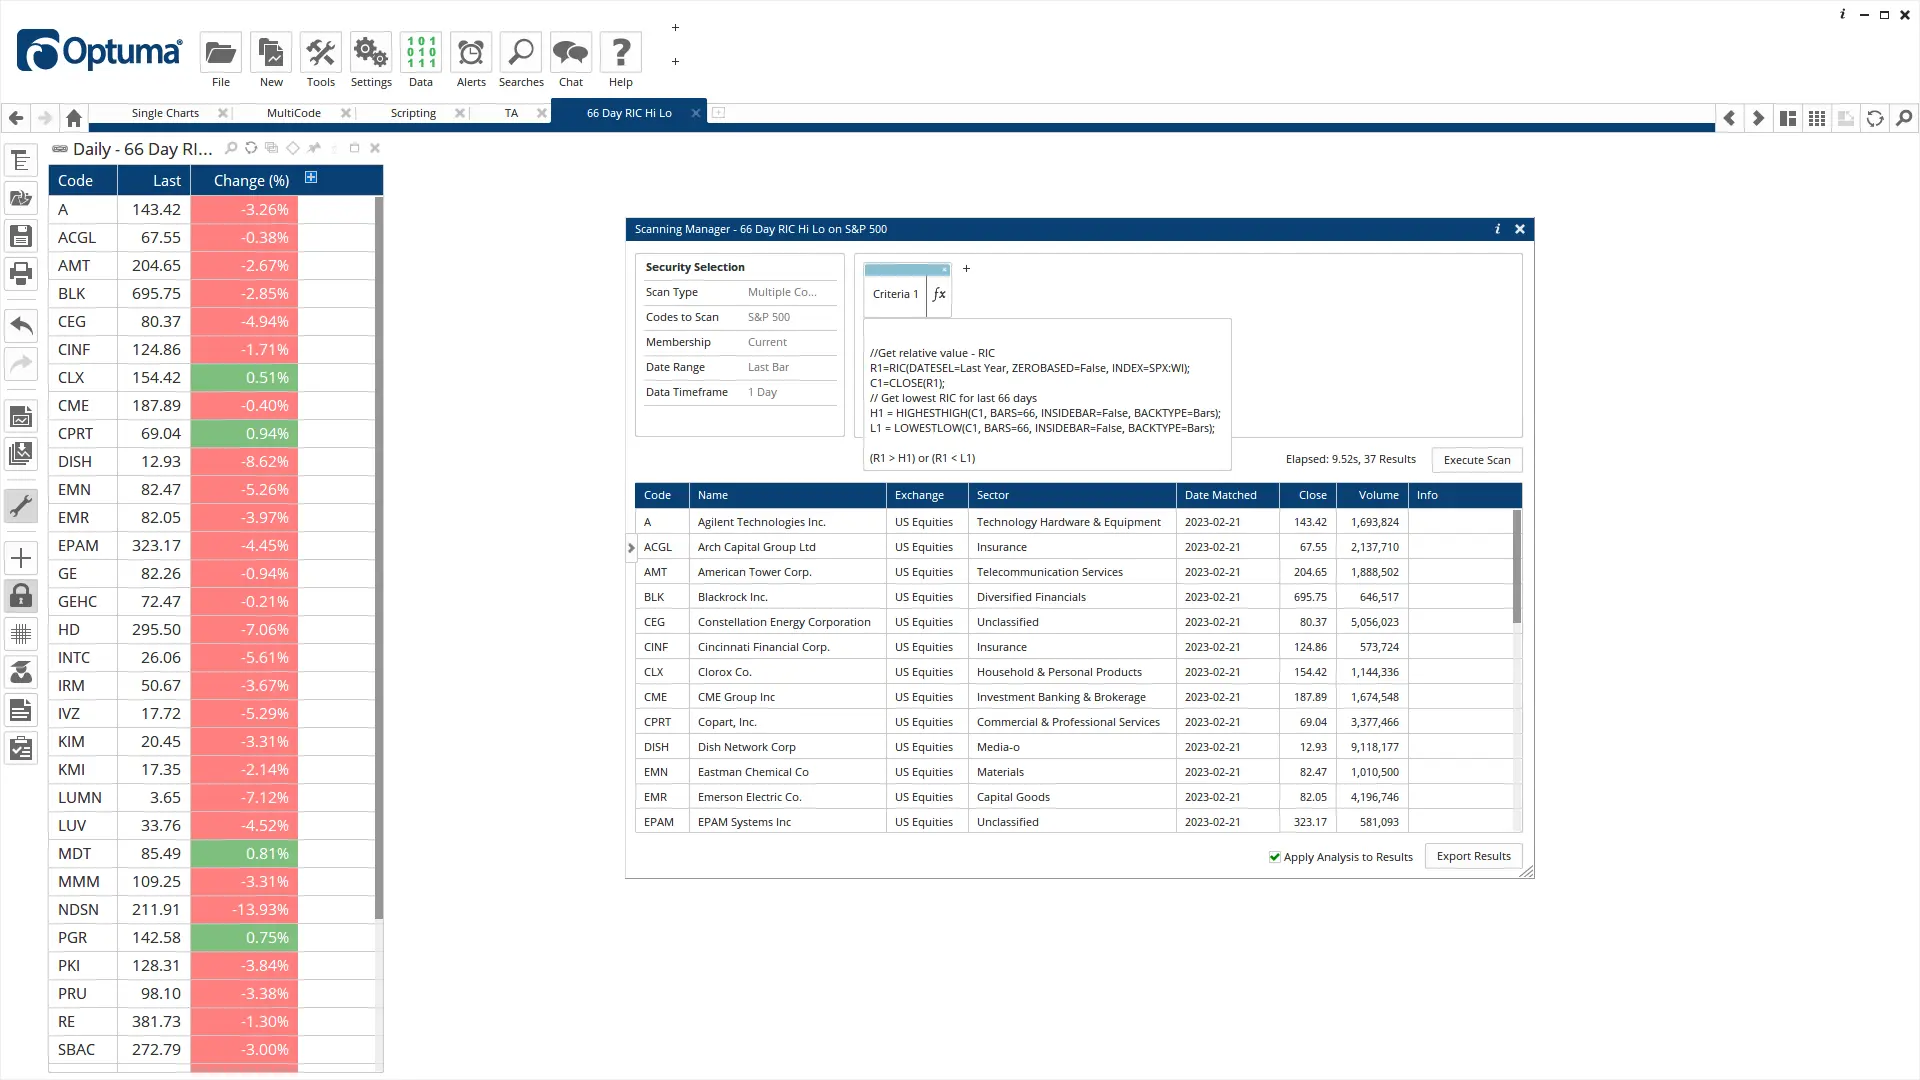
Use the Scanning Manager to quickly search through thousands of securities and short-list those matching your criteria. If you link that scan to a Watchlist, it runs automatically every time you open the Watchlist. There is no easier way to keep your eye on the whole market.
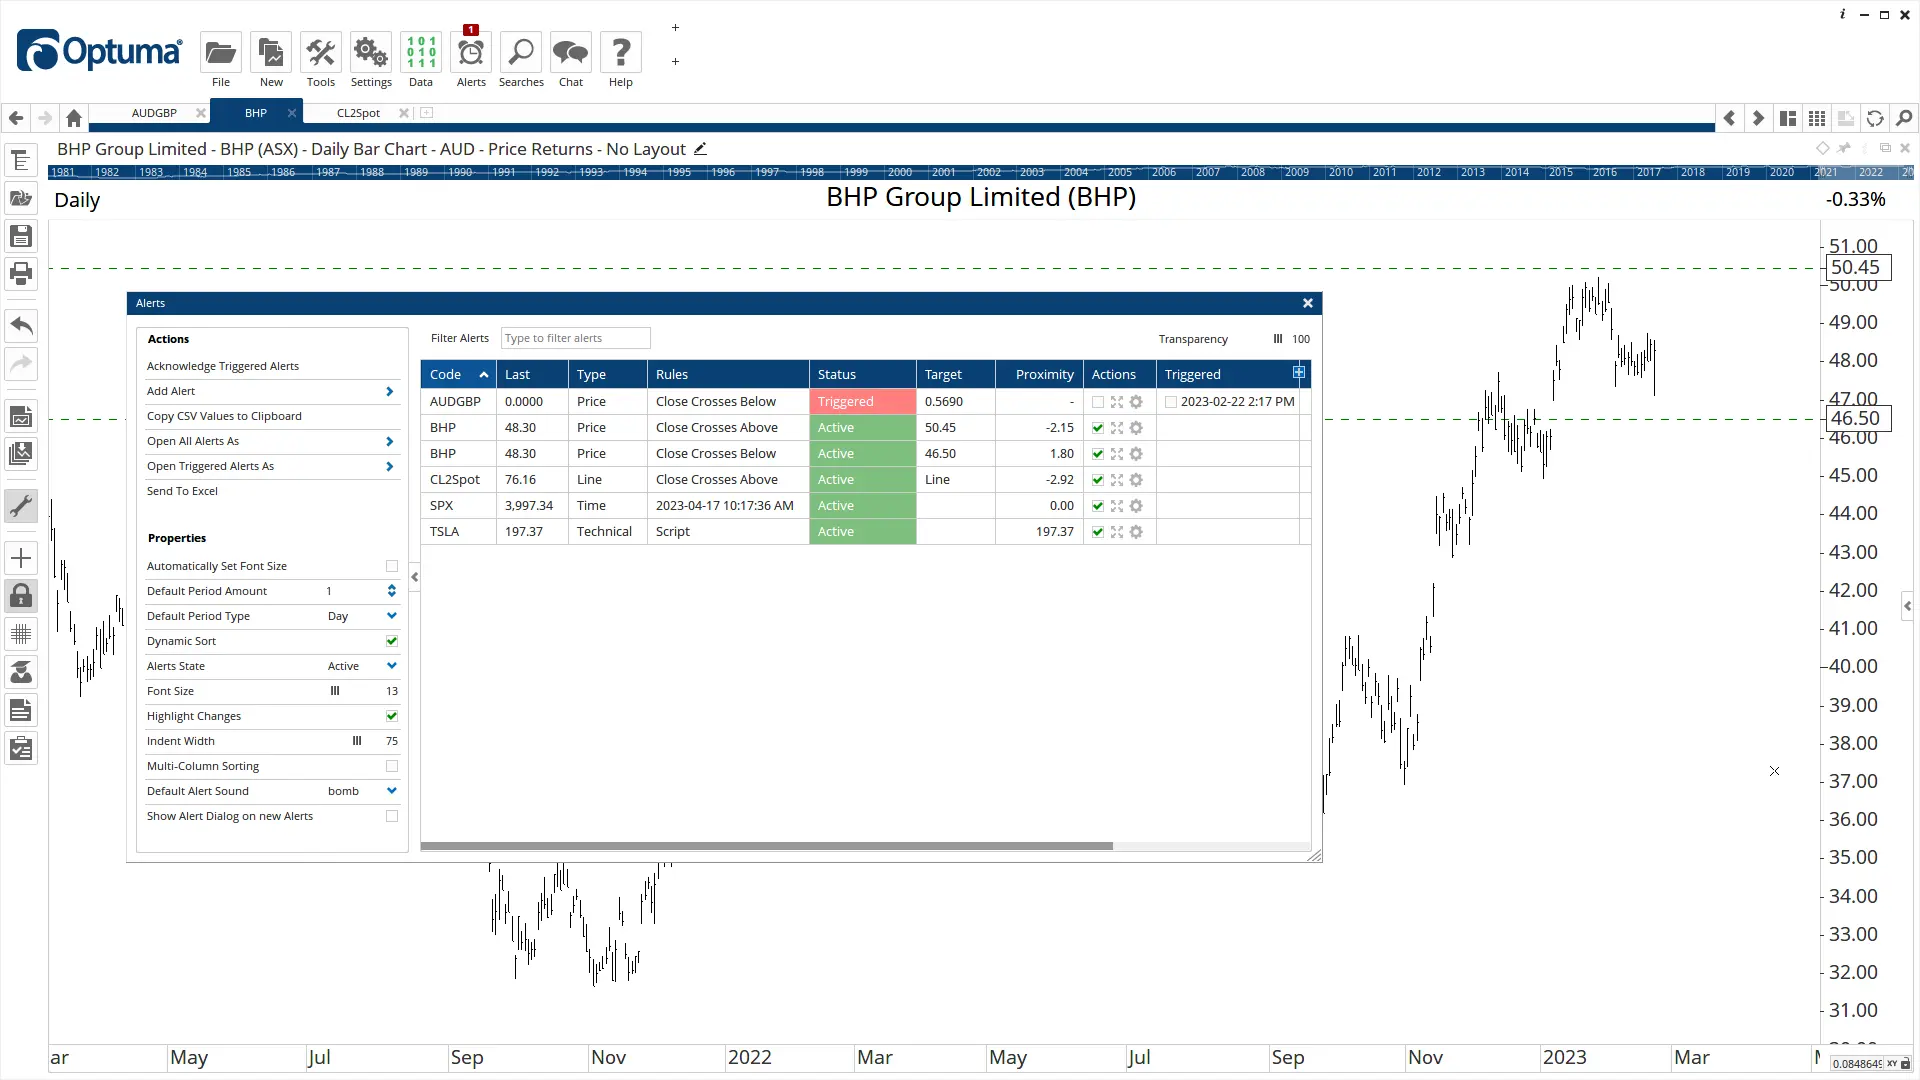
Have you ever waited for a security to break through an angled trend line? Or a particular level on an indicator? Optuma does this with ease. Once you identify your alerts, Optuma keeps monitoring them—using end of day or real-time data—and lets you know when they are triggered.
Get assistance from experts when you need it. Optuma’s team has over 45 years of combined experience helping industry professionals get the most out of their analysis.
Our support staff are friendly, responsive, and knowledgeable to give you trustworthy and timely support.
Available to all customers
Experts in the software and the application of every tool
Our team at Optuma created a comprehensive library of all questions, issues, and solutions that people have had using Optuma.
The Knowledge Base includes an in-depth overview of every indicator, chart, alert, and feature in Optuma. It’s extremely easy to learn new techniques in Optuma with the Knowledge Base at your fingertips.
Start your free trial today
The possibilities are endless. Simplify your process. Increase your confidence.
Optuma is for experienced private traders, professionals, and enterprises wanting a platform for advanced financial and technical analysis. If you are just starting out and simply need moving averages and a few indicators, Optuma may not be the best program for you. Call our support team to discuss your needs.
Optuma is a sophisticated financial tool that requires a certain level of mastery. Our team developed several resources to assist you in getting started with Optuma.
Upon signing up for a trial or purchasing Optuma, every user receives a welcome email series with videos on getting started. In addition, we offer free courses on advanced Optuma features and tools on learn.optuma. To quickly find answers to any question you may have, Optuma’s knowledge base contains written breakdowns of all tools, features, and processes. If you require more personalised assistance, you may schedule a consultation call with one of our experts.