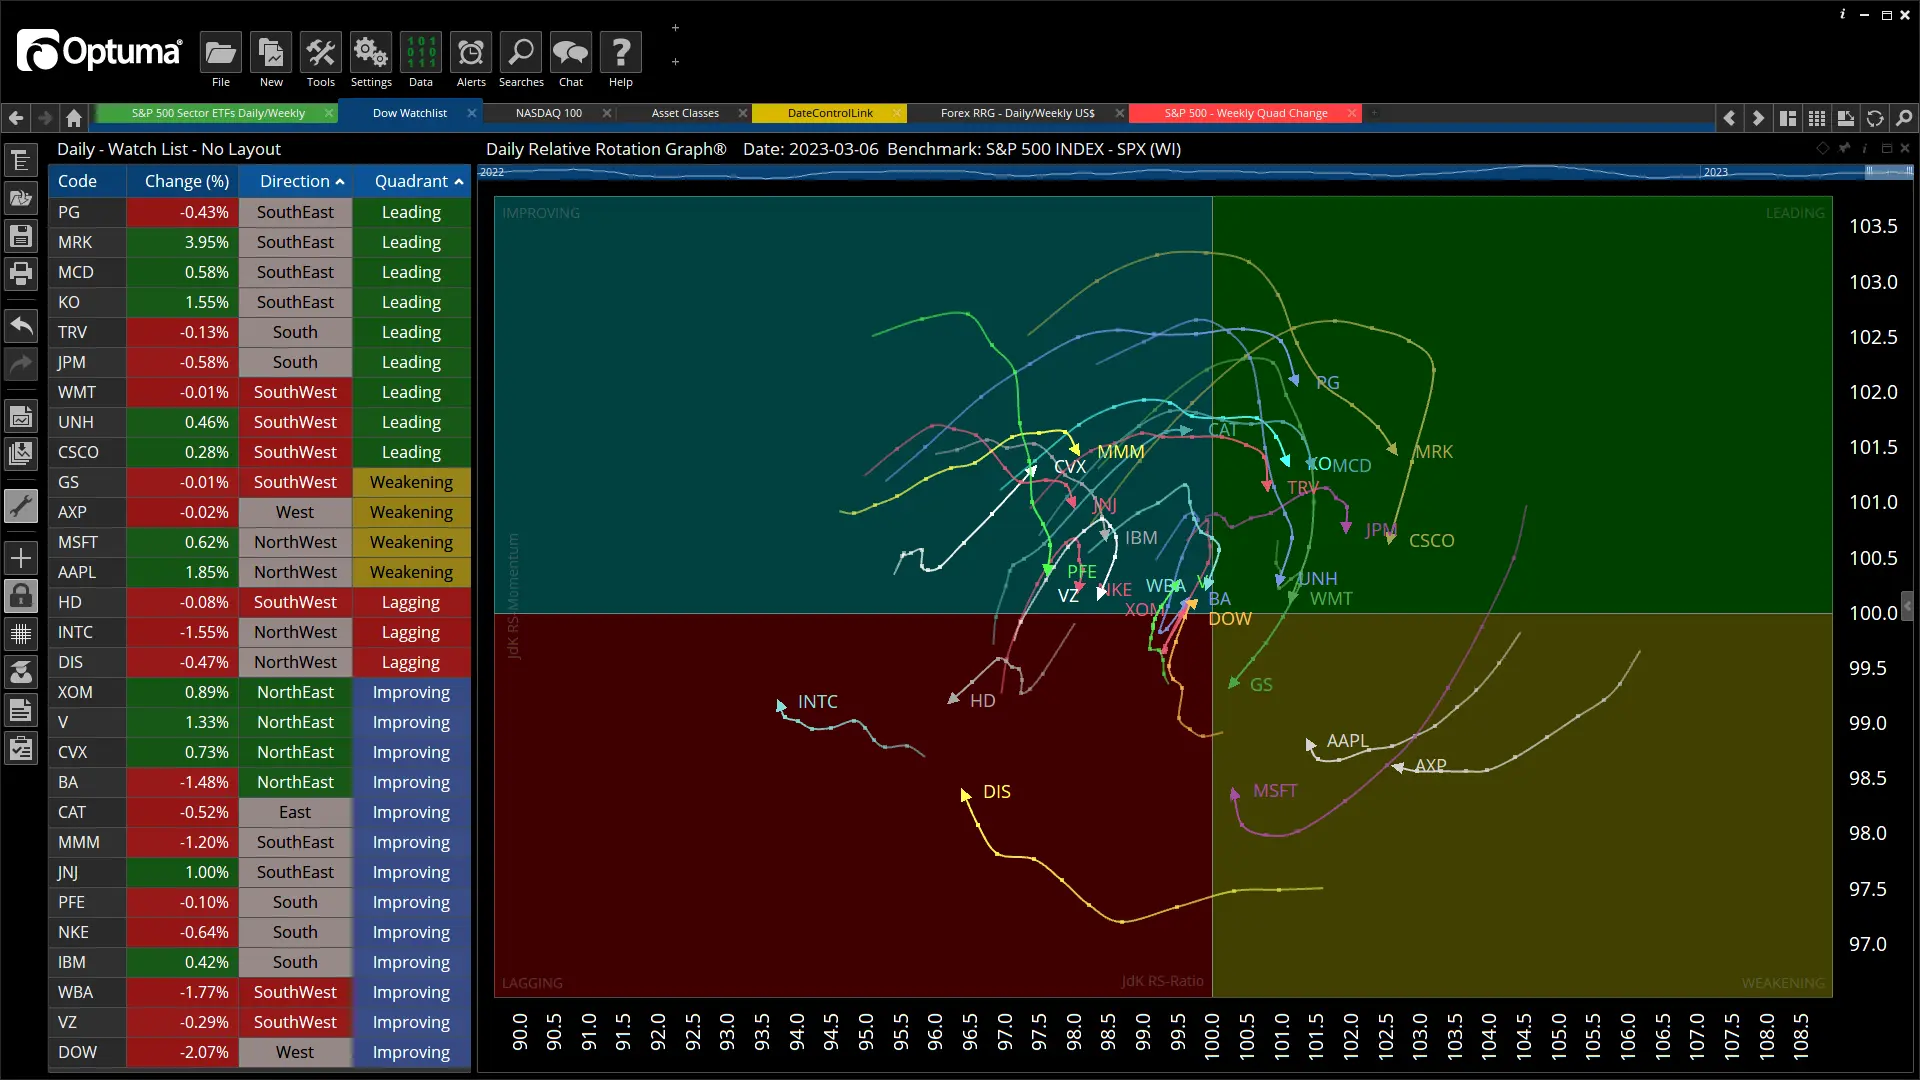
Relative Rotation Graphs (RRG®) are a unique charting tool that help visualise the relative performance of different securities or asset classes. Developed by Julius de Kempenaer, RRGs provide a top-down visual representation of how different securities or asset classes are performing relative to a core index, as well as one another. RRGs allow you to quickly identify emerging trends and shifts in the market.
By following the movement of each security over days and weeks, you will see the cyclical clockwise direction develop as they move around the comparison index, from Leading, Weakening, Lagging, and Improving.
Each quadrant represents different states of the security in comparison to the selected index…
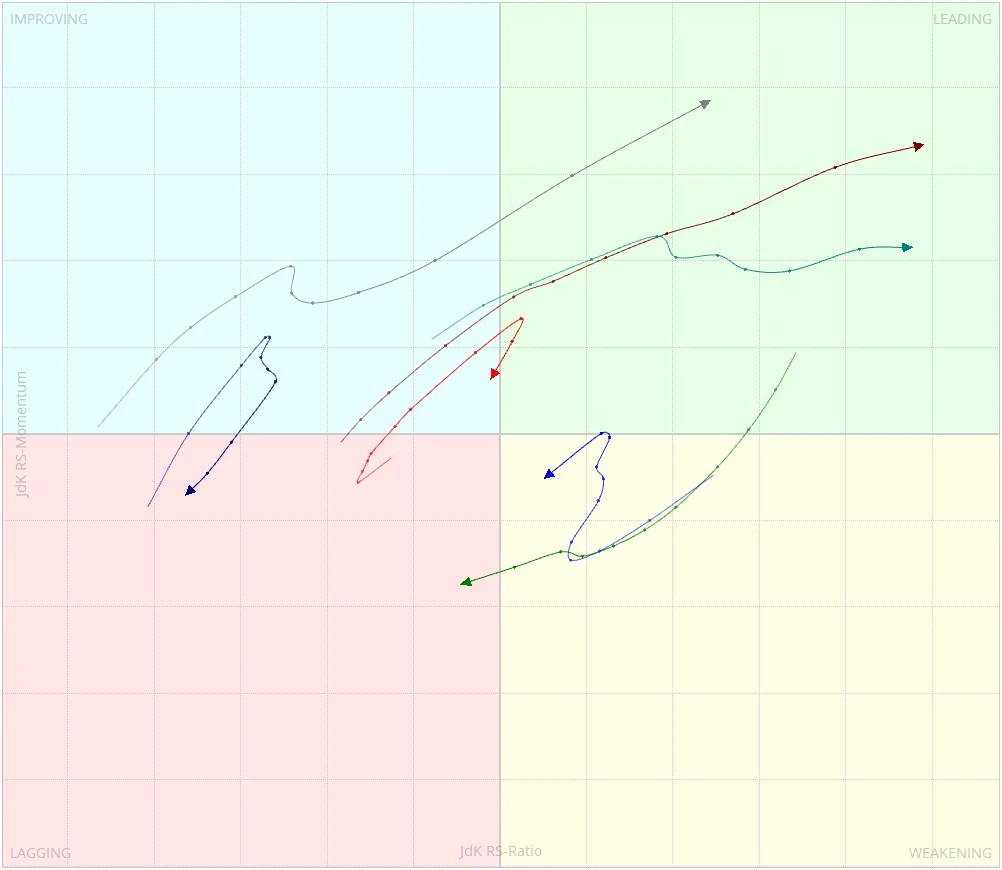
Leading (Green)– Securities with strong relative strength and momentum, indicating they are currently outperforming the index or peers.
Weakening (Yellow) – Securities with strong relative strength but weak momentum, suggesting they may be losing steam and starting to underperform.
Lagging (Red) – Securities with weak relative strength and momentum, indicating they are currently underperforming the index or peers.
Improving (Blue) – Securities with weak relative strength but growing momentum, indicating they may be starting to turn around and potentially become leaders in the future.
The RRG cycle plays out on a colour-coded quadrant allowing you to quickly scan a large number of securities or asset classes at once and identify which ones are worth further investigation. It’s much faster than alternative methods of relative comparison analysis.
* RRG Scripting and FX RRGs are available as part of the RRG Professional Module only
Optuma and RRG Ltd have worked together for over 10 years to build the most comprehensive implementation of RRG charts available anywhere today. Through this partnership, new RRG features have created untapped avenues of relative strength analysis, such as the FX RRG chart, the only chart that can show a true RRG representation of global currency pairs.
Using RRG in Optuma you can:
Create RRGs from Watchlists, Symbol Lists, and Market Scan Results.
Move back and forth through the entire history of a security. Identify patterns as each security moves around a central comparison index.
Manually adjust the sensitivity of rotations so you can control how quickly the securities react to market movements.
Access RRG-based metrics that are only available within Optuma including Angle, Heading, Rate of Change, Quadrant, and Distance.
By adding these additional metrics you can fine-tune your RRG-based strategies so only securities with the most potential are found. This isn’t just theory. Using Optuma’s comprehensive Quantitative Testing module you can see what the statistics have to say on any RRG-based model you can think of.
Buying out-performers is too late – This paper tests buying outperforming securities using Relative Rotation Graphs (RRGs) to improve absolute returns. It challenges the assumption of recommending securities based solely on past performance and shows the need for a different approach to buying securities. The paper explains RRG and presents results from testing in all market conditions.
RRG Weights – Relative Rotation Graphs (RRGs) are one of the most powerful ways that Relative Strength can be displayed and normalised on a single chart. We explore whether a set of securities on the RRG benchmarked against an index made up of only those securities can be balanced on the X and Y axis. The results once we include Market Capitalisation are amazing.
View the markets with a clear lens
Sign-up for your free trial to Optuma
All Optuma plans come with access to Relative Rotaton Graphs, although the level of functionality may vary depending on the plan you choose. Optuma Trader users have access to RRG Lite, which provides basic functionality for RRGs. Optuma Professional and Enterprise users, on the other hand, have access to the full version of RRGs, which includes advanced features and customization options.
You can learn more about RRG’s in Optuma by reading our Knowledge Base or taking a look at this video.
Copyright 2025 © Optuma Pty Ltd
Level 6, 200 Adelaide St, BRISBANE QLD 4000, AUSTRALIA
ABN 41 628 890 095