GoNoGo Functions
There are four functions associated with the GoNoGo tool module:
GNGOSC()for the OscillatorGNGSQUEEZE()for the Squeeze valuesGNGTREND()* for new Go / NoGo signalsGNGTRENDPRO()for new Go / NoGo signals, status, and icons
*Note
The GoNoGo Trend tool and GNGTREND() function are available for free to all clients
GNGOSC()
This function calculates the value of the oscillator, with the Blue and Aqua outputs having a value of 1 when the condition is true.
For stocks with an oscillator value > 2 and coloured blue:
GNGOSC() > 2 and GNGOSC().Blue
GNGSQUEEZE()
To scan for stocks with a squeeze value of 6:
GNGSQUEEZE().Squeeze6
GNGTREND()
This function will display a value of 1 for a new Go signal, or -1 for NoGo. To scan for new Go and NoGo signals:
GNGTREND() <> 0
GNGTRENDPRO()
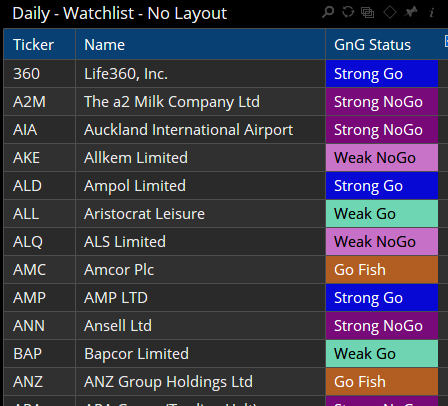
This function contains the outputs to identify the current GoNoGo status (Strong Go, Weak Go, Go Fish, Weak NoGo, Strong NoGo) and also the arrow and circle icons.
Use the following to scan for the status use the corresponding bar colour:
GNGTRENDPRO().Blue for Strong Go
GNGTRENDPRO().Aqua for Weak Go
GNGTRENDPRO().Orange for Go Fish
GNGTRENDPRO().Fucsia for Weak NoGo
GNGTRENDPRO().Purple for Strong NoGo
In a watchlist, use GNGTRENDPRO().Status to automatically display the label and colour:
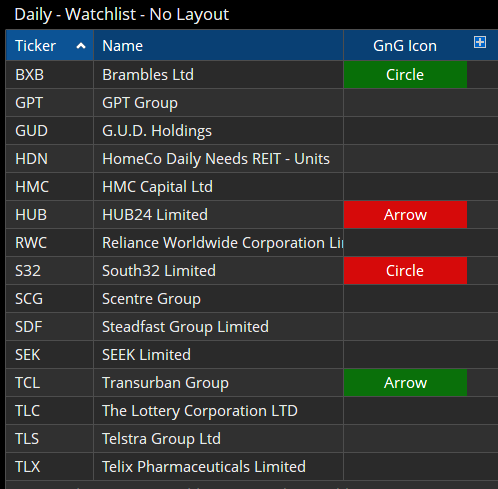
The following can be used to identify the icons:
GNGTRENDPRO().GreenCircle
GNGTRENDPRO().RedCircle
GNGTRENDPRO().GreenArrow
GNGTRENDPRO().RedArrow
In a watchlist, use GNGTRENDPRO().Icon to automatically display the icon label and colour: