GoNoGo Squeeze
Overview
The GoNoGo Squeeze indicators builds on the GoNoGo Oscillator indicator.
Studies have shown that momentum readings are not only useful for mean-reversion strategies but can also add insight within trend.
GoNoGo Oscillator is calculated so that when inputs are in neutral territory, it rests at zero. Meaning, when enthusiasm wanes within a trending market, GoNoGo Oscillator® provides an objective point of support/resistance for momentum at the zero line.
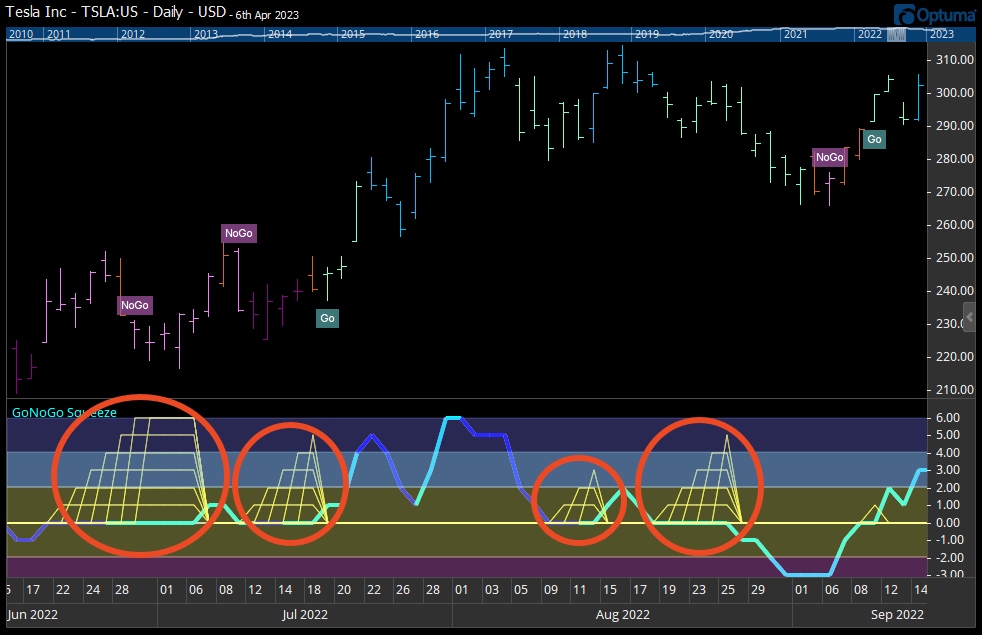
Where there is no excessive buying or selling, price action stagnates, volatility declines, markets move sideways, and GoNoGo Oscillator® rests at the zero line. This volatility compression is highlighted by GoNoGo Squeeze®.
A visual grid in the oscillator panel climbs as momentum remains neutral reaching extremes with prolonged reduction in volatility. Like a coiled spring, research has shown that following these stalemates between buyers and sellers, a breakout can be expected.
To add the tool to your chart, select the tool from the GoNoGo tool group, and left-click on the chart to add the tool. Optuma will then draw the tool in a window below the chart using the default settings.
Scripting: GNGSQUEEZE()
To scan for when the GoNoGo Squeeze has a value of 6:
GNGSQUEEZE().Squeeze6
Actions and Properties
Actions
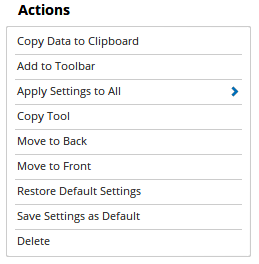
Copy Data to Clipboard: Will copy the tool’s values to the clipboard which can then be inserted into a spreadsheet, for example, allowing for further analysis.
Add to Toolbar: Adds the selected tool to your custom toolbar.
Apply Settings to All: When multiple GoNoGo Squeeze tools have been applied to a chart, page or workbook, this action can be used to apply the settings of the one selected to other instances of the tool. This is a great time saver if an adjustment is made to the tool - such as line colour - as this allows all the other GoNoGo Squeeze tools in the chart, page or entire workbook to be updated instantly.
Copy Tool: Allows you to copy the selected tool, which can then be pasted onto a different chart window.
Move to Back: If the tool is displaying in front of other tools or indicators clicking this action will move the tool view to the background.
Move to Front: If the tool is displaying behind other tools or indicators on the chart, clicking this action will bring the tool to the forefront.
Restore Default Settings: Click this action if you have adjusted the default settings of the tool, and wish to return to the standard properties originally installed with Optuma.
Save Settings as Default: If you have adjusted any of the tool’s properties (colour, for example) you can save the adjustments as your new default setting. Each time you apply a new GoNoGo Squeeze tool to a chart, the tool will display using the new settings.
Delete: Deletes the tool from the chart.
Properties
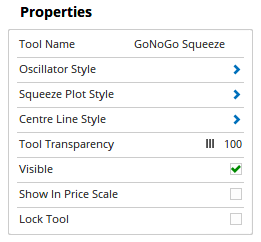
Tool Name: Allows you to adjust the name of the tool, as it’s displayed in the Structure Panel.
Oscillator Style: This option expands to show the following:
- Plot Style - Allows you to change how the Oscillator line is displayed on your chart. There are 6 options available: Line, Dot, Histogram, Step, Shaded, Shaded Step.
- Line Style - The Line Style property allows you to adjust the type of the line displayed. There are 8 options available: Solid, Dots, Dash, Dash Dots, Long Dash, Long Dash Dot, Long Dash Dot Dot, Stippled.
- Line Width - Allows you to adjust the width of the lines. Moving the slider bar to the right increases the thickness of the line.
- Fill Up / Down Barrier - When the Plot Style is set to Shaded you are able to adjust the barrier value. The default value is 0.00.
- Fill Up Colour - When the Plot Style is set to Shaded you are then able to alter the Fill Colour for the tool.
- Fill Down Colour - When the Plot Style is set to Shaded you are then able to alter the Fill Colour for the tool.
- Fill Transparency - When the Plot Style is set to Shaded you are then able to adjust the shading transparency. Moving the slider to the left will increase the transparency of the tool.
Squeeze Plot Style: This option expands to show the following:
- Plot Style - Allows you to change how the Squeeze lines are displayed on your chart. There are 6 options available: Line, Dot, Histogram, Step, Shaded, Shaded Step.
- Line Style - The Line Style property allows you to adjust the type of the line displayed. There are 8 options available: Solid, Dots, Dash, Dash Dots, Long Dash, Long Dash Dot, Long Dash Dot Dot, Stippled.
- Line Width - Allows you to adjust the width of the lines. Moving the slider bar to the right increases the thickness of the line.
- Line Colour - Allows you to select the colour of the line. Clicking on the drop down arrow will display a colour swatch. Locate the desired colour and left-click it once to select it.
- Fill Up / Down Barrier - When the Plot Style is set to Shaded you are able to adjust the barrier value. The default value is 0.00.
- Fill Up Colour - When the Plot Style is set to Shaded you are then able to alter the Fill Colour for the tool.
- Fill Down Colour - When the Plot Style is set to Shaded you are then able to alter the Fill Colour for the tool.
- Fill Transparency - When the Plot Style is set to Shaded you are then able to adjust the shading transparency. Moving the slider to the left will increase the transparency of the tool.
Centre Line Style: This option expands to show the following:
- Line Style - The Line Style property allows you to adjust the type of the line displayed. There are 8 options available: Solid, Dots, Dash, Dash Dots, Long Dash, Long Dash Dot, Long Dash Dot Dot, Stippled.
- Line Width - Allows you to adjust the width of the lines. Moving the slider bar to the right increases the thickness of the line.
- Line Colour - Allows you to select the colour of the line. Clicking on the drop down arrow will display a colour swatch. Locate the desired colour and left-click it once to select it.
- Transparency - Use this slider bar to adjust the transparency of the Level lines. Moving the slider to the left will increase the transparency of the tool.
- Visible - Untick this checkbox to remove the Centre Line from view.
Tool Transparency: Use this slider bar to adjust the transparency of the tool. Moving the slider to the left will increase the transparency of the tool.
Visible: Untick this checkbox to remove the tool from view, while leaving the window below the chart in place.
Show in Price Scale: When selected the current GoNoGo Squeeze value will be displayed in the Price Scale.
Lock Tool: When this checkbox is ticked the tool can’t be deleted from the chart and none of the tools properties can be modified.