GoNoGo Trend
Overview
Note
From Optuma 2.2 this tool is available free to all clients with an active subscription.
Trend identification is arguably the most important concept in technical analysis. By blending objective, widely proven statistical indicators together with the foundational principles of technical analysis, GoNoGo Trend® colors the price action of any security according to the strength of its trend.
Free from the clutter of many technical charts, GoNoGo Trend is easy to interpret. It paints the price bars bright blue when its unique mix of inputs signal the strongest bullish environment. When slightly less bullish, the color turns to aqua.
This can happen at the start of a new trend, or after bright blue bars, indicating that the trend may be weakening. The amber bars represent uncertainty, often appearing in the transition from bull trend to bear trend and vice versa.
The lower-intensity bearish color is pink, and the darker purple appears when the bearish trend intensifies.
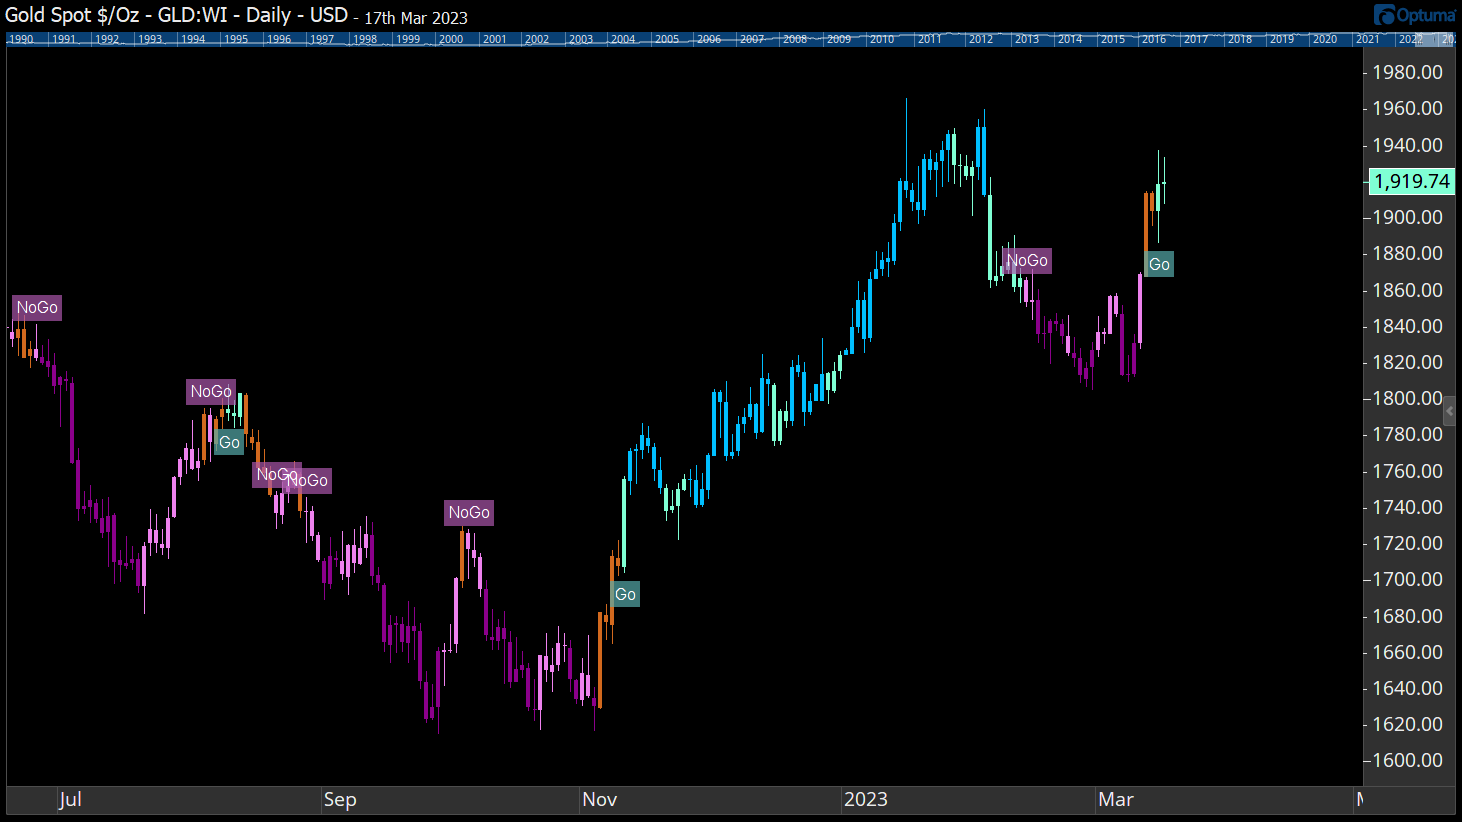
To add the tool to your chart, select the tool from the GoNoGo tool group, and left-click on the chart to add the tool. Optuma will then draw the tool using the default settings. You will see the bars change colour, as well as the addition of Go and NoGo labels.
Scripting: GNGTREND()
A value of 1 signals a new Go signal, and -1 a new NoGo signal. This example in a scan will show new Go and NoGo labels:
GNGTREND()==1 or GNGTREND()==-1
Actions and Properties
Actions
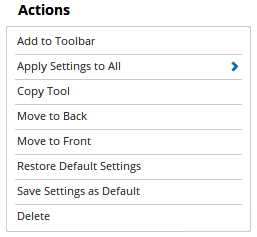
Add to Toolbar: Adds the selected tool to your custom toolbar.
Apply Settings to All: When multiple GoNoGo Trend tools have been applied to a chart, page or workbook, this action can be used to apply the settings of the one selected to other instances of the tool. This is a great time saver if an adjustment is made to the tool - such as line colour - as this allows all the other GoNoGo Trend tools in the chart, page or entire workbook to be updated instantly.
Copy Tool: Allows you to copy the selected tool, which can then be pasted onto a different chart window.
Move to Back: If the tool is displaying in front of other tools or indicators clicking this action will move the tool view to the background.
Move to Front: If the tool is displaying behind other tools or indicators on the chart, clicking this action will bring the tool to the forefront.
Restore Default Settings: Click this action if you have adjusted the default settings of the tool, and wish to return to the standard properties originally installed with Optuma.
Save Settings as Default: If you have adjusted any of the tool’s properties (colour, for example) you can save the adjustments as your new default setting. Each time you apply a new GoNoGo Trend tool to a chart, the tool will display using the new settings.
Delete: Deletes the tool from the chart.
Properties
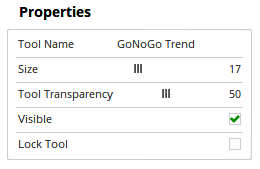
Tool Name: Allows you to adjust the name of the tool, as it’s displayed in the Structure Panel.
Size: Use this slider bar to increase or decrease the size of the Go / NoGo labels appearing on the chart.
Tool Transparency: Use this slider bar to adjust the transparency of the tool. Moving the slider to the left will increase the transparency of the tool.
Visible: Un-tick this checkbox to hide the tool from view.
Lock Tool: When this checkbox is ticked the tool can’t be deleted from the chart and none of the tools properties can be modified.