General Chart Actions & Properties
Overview
General chart settings are available for any chart type in Optuma and can be accessed in the left-hand panel by left-clicking once on a blank area of the chart window. Alternatively, right-click on the chart background to select the Actions and Properties from their respective menus.
Actions
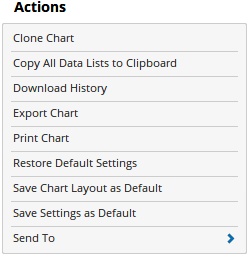
Clone Chart: Allows you to duplicate the existing chart with its tools and indicators. It will be placed above the existing chart and from here it can either be moved to a new page or tiled alongside your existing chart(s). See the Smart Tiling section here.
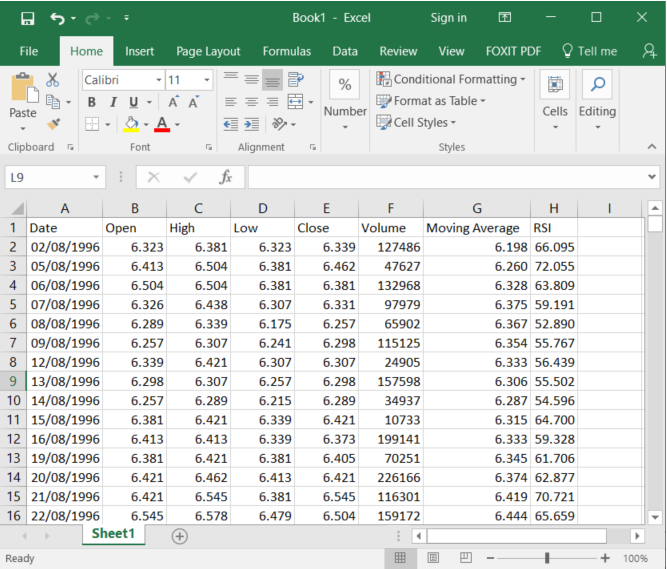
Copy All Data Lists to Clipboard: Allows you to copy the raw data values from the chart, and any tools applied, which you can paste into Excel, or Notepad.
Note
When the data is pasted into a program like Excel, it will display in the following format (“Text to Columns” conversions maybe required in some versions of Excel)
Download History: Allows all historical data to be downloaded for the selected security (requires an Optuma data subscription).
Note
Clicking on this option on an intraday chart will replace your existing data with a new file from your intraday data provider. As this may contain less history than you had previously available we recommend using the Clear Cache to this Bar option by right-clicking on a bar and selecting it from the Actions menu.
Export Chart: The existing chart will be exported as a workbook file to a selected folder. The export function allows you to give the exported workbook a new name and to also select the desired pages which are to be included, along with any Chart Layouts, Page Layouts or Watchlist Layouts that have been applied.
Print Chart: Opens the chart/workbook in a PDF document, which can then be printed. Right-click on the print icon in the Actions Bar to bring up the Print Settings menu.
Restore Default Settings: If you have previously altered the general chart settings, clicking this action will revert the properties back to default settings.
Save Chart Layout as Default: The current chart layout will be saved as the default setting.
Save Settings as Default: If you have adjusted any of the chart’s properties (such as the colour scheme, for example) you can save the adjustments as your new default setting. Each time you open a new chart it will display using the new settings.
Send To: This option allows the current chart to be saved as either an image file, saved to the clipboard or added to a Manual List. If you have Professional Services then the additional options of sending the chart via Chat Message, to Word and Outlook are also available.
Properties
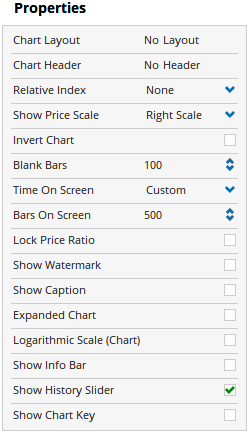
Chart Layout: Displays the selected Chart Layout, left clicking on this field allows the Layout to be changed. For more information on Chart Layouts, see here.
Chart Header: Applicable for Professional and Enterprise Services only, left click on this field to select or add a new Chart Header. For more information on Chart Headers, see here.
Relative Index: Allows you to change from a Price Chart to a Relative Chart. Click on this property to select the default index, or select Custom Comparison Index and type the required code. For more information on this, see here.
Relative Code: When Relative Index is set to Custom Comparison Index, this property allows you to select the comparison index code for your Relative Chart.
Show Price Scale: Allows you to adjust where the price scale is located on the chart. There are 4 options available: None, Right Scale, Left Scale, Both.
Invert Chart: When selected, will invert the price scale and the direction of the chart (the word ‘Inverted’ is added to the chart’s background when this action is enabled).
Blank Bars: This value relates to the amount of space displayed on the right-hand side of the chart. After the last bar, there will be an area of blank charting space used for plotting tools and indicators into the future. Increasing this value will increase the amount of blank space.
Time on Screen: Sets the amount of bars that are to be displayed on screen at any one time, e.g. if set to 1 year then only 1 year’s of data will be displayed.
Bars On Screen: If Time on Screen is set to Custom, this value then determines the number of bars visible on the screen (includes the number of Blank Bars).
Lock Price Ratio: When this option is enabled, a new value called Time Price Ratio is displayed. This value can be set to ensure a constant ratio of time and price is kept while zooming in and out of the selected chart.
Show Watermark: To easily identify the active chart this option allows for the code, page name or closing price to be displayed on the background of the chart.
Show Caption: When selected the ticker symbol and company name will be displayed at the top left corner of the chart.
Expanded Chart: When enabled, the History Slider and date scale will be hidden from view, giving the chart additional room to display.
Logarithmic Scale: Logarithmic charts allow you to see vertical changes in terms of percentage rather than price. For example, on a chart using a Logarithmic Scale the vertical distance between $10 and $20 (a 100% increase) is the same as the vertical distance between $50 and $100. Because these charts show percentage relationships, logarithmic scaling is also called % scaling. It is also called “semilog” scaling because only one of the axes (the vertical one) is scaled logarithmically.
Show Info Bar: When enabled, the information bar will be added to the bottom left corner of the chart. This bar displays the date, open, high, low, close, range, volume and position of the cursor.
Show History Slider: Deselecting this check box will hide the History Slider from view.
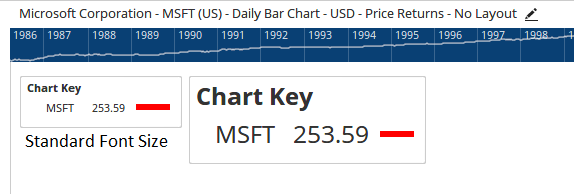
Show Chart Key: Enabling this option will display a chart key, showing the details of the chart and indicators price & colour. You can edit the labels by double-clicking them in the Chart Key, you can also compress and expand each layer shown within the Chart Key.
Key Font Size: Available from Optuma 2.0 and later, this property will appear when the Chart key is enabled. You can use the slider bar to adjust the font size of the chart key larger or smaller.