Optuma EOD Splits, Consolidations and Total Returns
Overview
Optuma EOD Data includes adjustments for share splits, consolidations, as well as factors for Total Returns. Optuma supports three different display types for these adjustments:
- Price Returns (Default): The chart will display with all exchange-issued back adjustments applied to the chart.
- Total Returns: Total return shows the chart with all distributions taken into consideration (i.e. dividends (if a stock), coupons (if a bond), or capital gains (if a fund), etc).
- Unadjusted: No adjustments are applied, the chart values are the raw Open, High, Low, Close as they occurred on each day.
Changing the Display Options
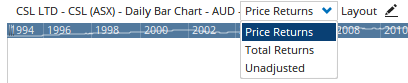
The property to toggle the chart’s display style between Price Returns, Total Returns, and Unadjusted can be found in the title bar, along the top of the chart window.
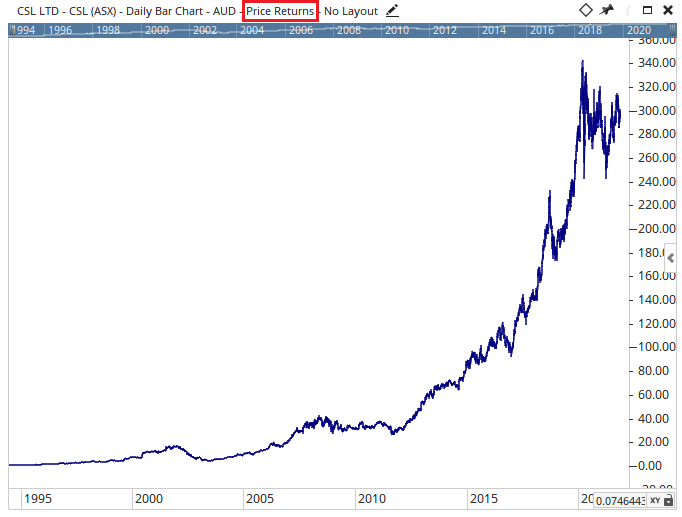
Clicking on this toggle will display a drop-down selector with each available option.
Note: This drop-down will not appear in the charts title bar if no split / total return data is available.
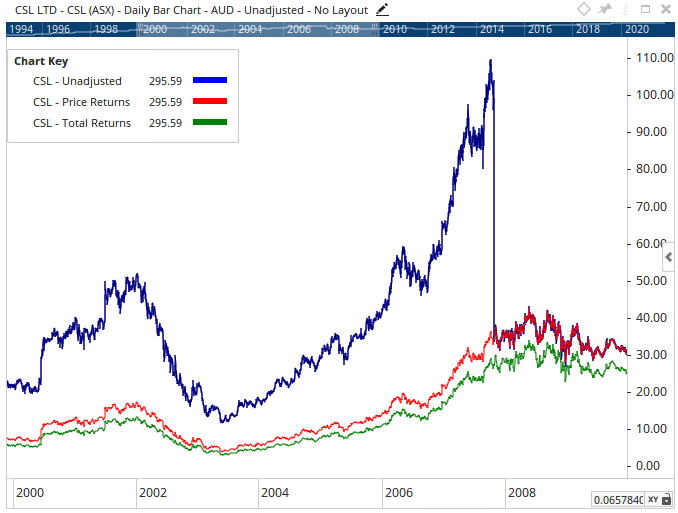
Below is an example of how the 3 different options affect the charts view:
Watchlists, RRGs, & Relative Comparison Charts
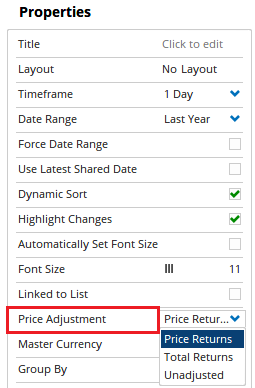
By default, Watchlists, Relative Rotation Graphs, and Relative Comparison charts will be calculated based on price return data. To use Total Returns instead change the Price Adjustment property:
Columns in the watchlist will then be calculated on Total Return data. To keep some columns using Price Return and some using Total Return a formula can be created using the TRET() function.
Note
For more information on Price Returns vs Total Returns click here.
Unadjusted Data
Occasionally companies announce stock splits, such as a 2-for-1, where the stock price is halved but stock holders end up with twice as many shares. This means that yesterday you had 1,000 shares at $50, but following the 2-for-1 split today you have 2,000 shares at $25 each.
At Optuma we back-adjust the stock’s price history so that if the high last year was $40 it will be adjusted to $20 to take into account the dilution.
However, if you wish to analyse pre-split charts to look at previous important price levels where the stock was actually traded you are able to ignore these price adjustments by changing the drop-down in the chart header to Unadjusted.
In this example of Microsoft - which has had several stock splits since 1987 - you can see the difference between the split-adjusted data and the unadjusted data prior to 2003 in these logarithmic charts, with the split events highlighted in yellow.
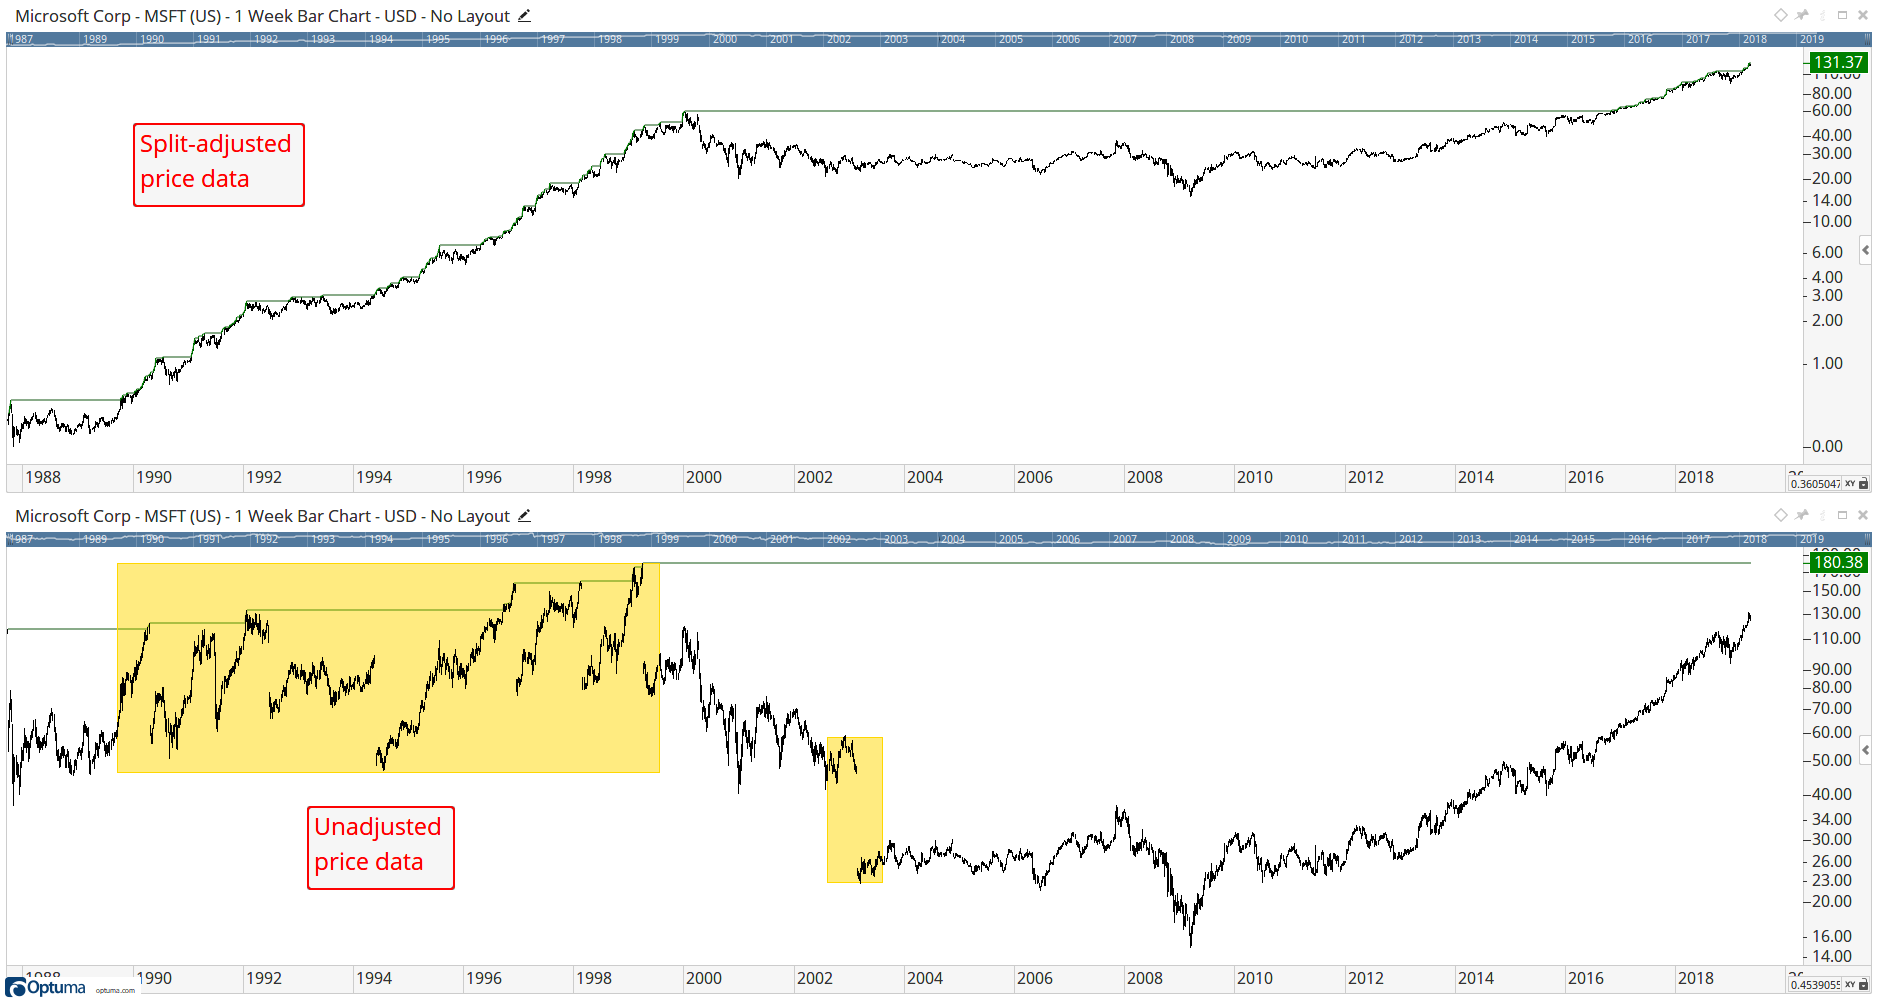
As you can see, MSFT traded at $180 in 1998 before subsequently going through two 2-for-1 splits. This means that the prices were adjusted by dividing by two in 1999 for the first split, and dividing again after the second split in 2003. As such, following the two 2-for-1 splits the $180 was adjusted to $45.