Turn Over
Overview
Turn Over provides a better indication of the liquidity of a security. i.e. the dollar value of the security that has turned over for the selected time period.
Calculation
Today's Volume x Today's Close
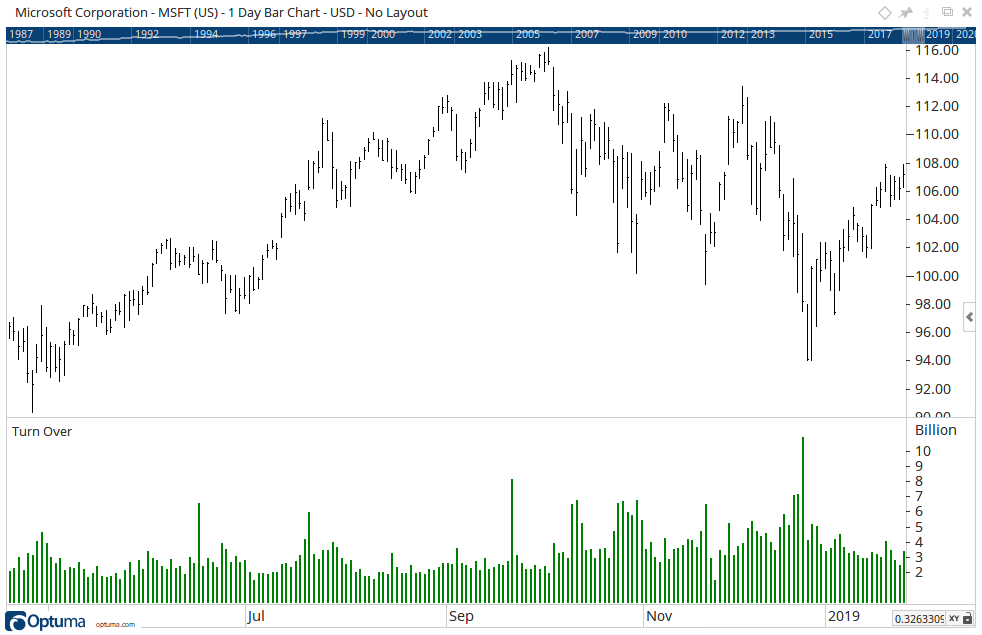
To add the tool to your chart, select the tool from the Volume tool group, and left-click on the chart to add the tool. Optuma will then draw the tool in a window below the chart using the default settings.
Scripting Function: TO()
Actions & Properties
Actions
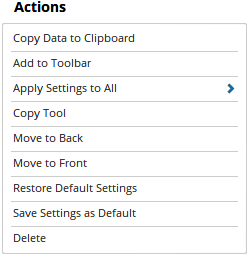
Copy Data to Clipboard: Will copy the tool’s values to the clipboard which can then be inserted into a spreadsheet, for example, allowing for further analysis.
Add to Toolbar: Adds the selected tool to your custom toolbar.
Apply Settings to All: When multiple Turn Over tools have been applied to a chart, page or workbook, this action can be used to apply the settings of the one selected to other instances of the tool. This is a great time saver if an adjustment is made to the tool - such as line colour - as this allows all the other Turn Over tools in the chart, page or entire workbook to be updated instantly.
Copy Tool: Allows you to copy the selected tool, which can then be pasted onto a different chart window.
Move to Back: If the tool is displaying in front of other tools or indicators clicking this action will move the tool view to the background.
Move to Front: If the tool is displaying behind other tools or indicators on the chart, clicking this action will bring the tool to the forefront.
Restore Default Settings: Click this action if you have adjusted the default settings of the tool, and wish to return to the standard properties originally installed with Optuma.
Save Settings as Default: If you have adjusted any of the tool’s properties (colour, for example) you can save the adjustments as your new default setting. Each time you apply a new Turn Over to a chart, the tool will display using the new settings.
Delete: Deletes the tool from the chart.
Properties
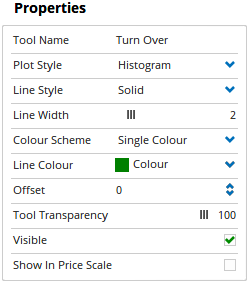
Tool Name: Allows you to adjust the name of the tool, as it’s displayed in the Structure Panel.
Plot Style: Allows you to change how the tool is displayed on your chart. There are 6 options available: Line, Dot, Histogram, Step, Shaded, Shaded Step.
Line Style: The Line Style property allows you to adjust the type of the line displayed. There are 8 options available: Solid, Dots, Dash, Dash Dots, Long Dash, Long Dash Dot, Long Dash Dot Dot, Stippled.
Line Width: Allows you to adjust the width of the line. Moving the slider bar to the right increases the thickness of the line.
Line Colour: Allows you to select the colour of the line. Clicking on the drop down arrow will display a colour swatch. Locate the desired colour and left-click it once to select it.
Fill Up / Down Barrier: When the Plot Style is set to Shaded you are able to adjust the barrier value, the default value is 0.00.
Fill Up Colour: When the Plot Style is set to Shaded you are then able to alter the Fill Colour for the tool.
Fill Down Colour: When the Plot Style is set to Shaded you are then able to alter the Fill Colour for the tool.
Fill Transparency: Use this slider bar to adjust the transparency of the shading. Moving the slider to the left will increase the transparency.
Offset: This provides the option to offset the Turn Over from the chart, to adjust the offset value use the blue up and down arrows.
Tool Transparency: Use this slider bar to adjust the transparency of the tool. Moving the slider to the left will increase the transparency of the tool.
Visible: Un-tick this checkbox to hide the tool from the chart.
Show In Price Scale: When selected the current Turn Over value will be displayed in the Price Scale.