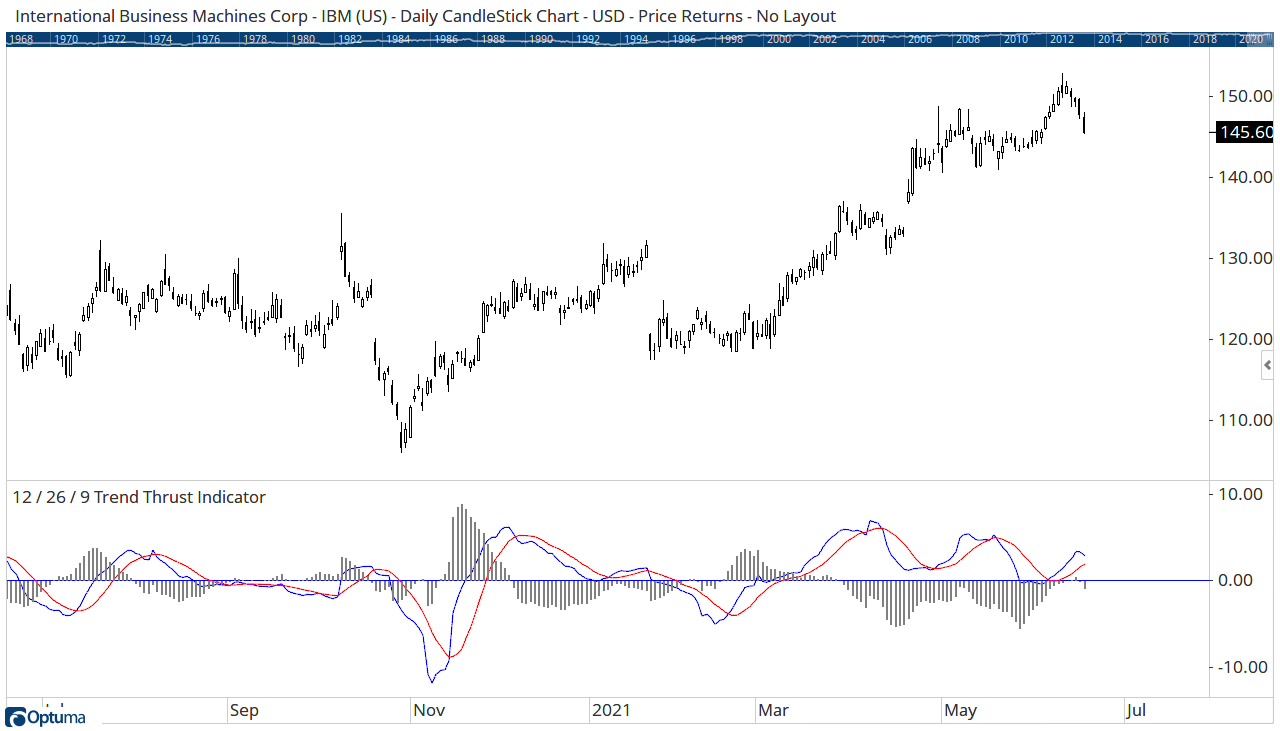
Trend Thrust Indicator
The Trend Thrust Indicator (TTI) is based on the work of Buff Dormeier, CMT in his book “Investing With Volume Analysis”. It is an enhanced version of the volume-weighted MACD indicator, where the TTI uses a volume multiplier in unique ways to exaggerate the impact of volume on volume-weighted moving averages. Like the VW-MACD, the TTI uses volume-weighted moving averages as opposed to exponential moving averages. Volume-weighted averages weigh closing prices proportionally to the volume traded during each time period, so the TTI gives greater emphasis to those price trends with greater volume and less emphasis to time periods with lighter volume.
##
Actions & Properties
Actions
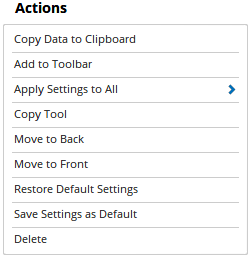
Copy Data to Clipboard: Will copy the tool’s values to the clipboard which can then be inserted into a spreadsheet, for example, allowing for further analysis.
Add to Toolbar: Adds the selected tool to your custom toolbar.
Apply Settings to All: When multiple TTI tools have been applied to a chart, page or workbook, this action can be used to apply the settings of the one selected to other instances of the tool. This is a great time saver if an adjustment is made to the tool - such as line colour - as this allows all the other TTI tools in the chart, page or entire workbook to be updated instantly.
Copy Tool: Allows you to copy the selected tool, which can then be pasted onto a different chart window.
Move to Back: If the tool is displaying in front of other tools or indicators clicking this action will move the tool view to the background.
Move to Front: If the tool is displaying behind other tools or indicators on the chart, clicking this action will bring the tool to the forefront.
Restore Default Settings: Click this action if you have adjusted the default settings of the tool, and wish to return to the standard properties originally installed with Optuma.
Save Settings as Default: If you have adjusted any of the tool’s properties (colour, for example) you can save the adjustments as your new default setting. Each time you apply a new TTI to a chart, the tool will display using the new settings.
Delete: Deletes the tool from the chart.
Properties
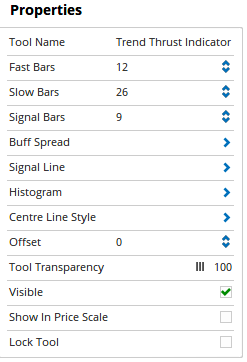 Tool Name: Allows you to adjust the name of the tool, as it’s displayed in the Structure Panel.
Fast Bars: The number of bars that are averaged in the fast moving average of the oscillator.
Slow Bars: The number of bars that are averaged in the slow moving average of the oscillator.
Signal Bars: The number of bars that are averaged in the signal.
Buff Spread: Expands to display the plot style properties of the line, such as colour, width, and transparency.
Signal Line: Expands to display the plot style properties of the line, such as colour, width, and transparency.
Histogram: Expands to display the plot style properties of the Histogram, such as colour, width, and transparency.
Centre Line Style: Expands to display the properties of the line, such as colour, width, and transparency.
Offset: Moves the tool forward or backwards in time. The offset is measured in bars, so a value of 2 will push the tool forward 2 bars and -2 will move the tool back 2 bars.
Tool Transparency: Use this slider bar to adjust the transparency of the tool. Moving the slider to the left will increase the transparency of the tool.
Visible: Un-tick this checkbox to hide the tool from the chart.
Show in Price Scale: When selected, the current TTI values will be displayed in the Price Scale.
Lock Tool: When selected, any changes to the tool will be prevented from being made.