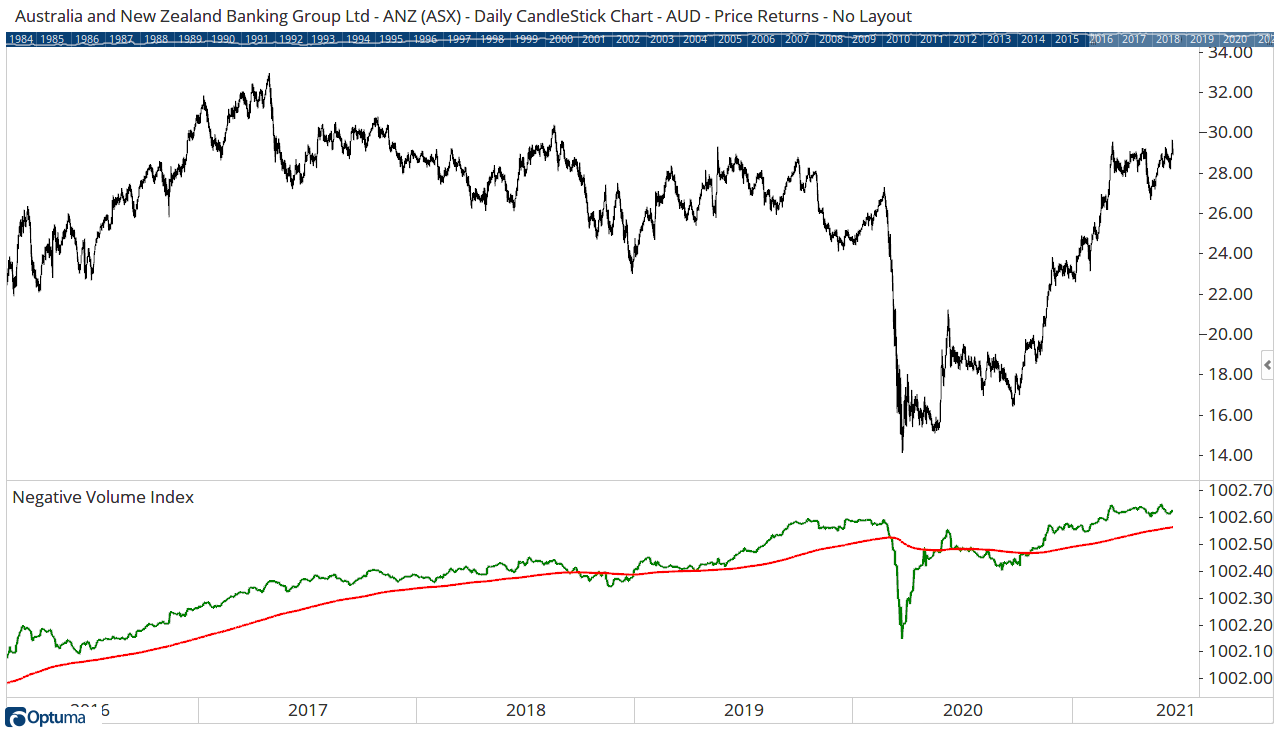
Negative Volume Index
The Negative Volume Index (NVI) is often used in conjunction with the Positive Volume Index (PVI) to identify bull and bear markets. The NVI focuses on days when the volume has decreased from the previous day. NVI’s premise is that the “uninformed crowd” takes positions on days when volume increases. The signal line is usually a 255 exponential moving average, but it can be adjusted.
Calculation:
If today’s volume is less than yesterday’s volume then:
*NVI = Yesterday’s NVI + [[(Close – Yesterday’s Close) / Yesterday’s Close] * Yesterday’s NVI
If today’s volume is greater than yesterday’s volume then:
NVI = Yesterday’s NVI
Scripting Function: NVI()
Actions & Properties
Actions
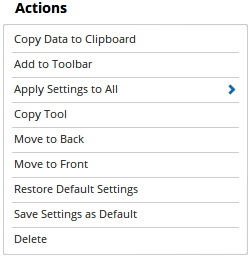
Copy Data to Clipboard: Will copy the tool’s values to the clipboard which can then be inserted into a spreadsheet, for example, allowing for further analysis.
Add to Toolbar: Adds the selected tool to your custom toolbar.
Apply Settings to All: When multiple NVI tools have been applied to a chart, page or workbook, this action can be used to apply the settings of the one selected to other instances of the tool. This is a great time saver if an adjustment is made to the tool - such as line colour - as this allows all the other NVI tools in the chart, page or entire workbook to be updated instantly.
Copy Tool: Allows you to copy the selected tool, which can then be pasted onto a different chart window.
Move to Back: If the tool is displaying in front of other tools or indicators clicking this action will move the tool view to the background.
Move to Front: If the tool is displaying behind other tools or indicators on the chart, clicking this action will bring the tool to the forefront.
Restore Default Settings: Click this action if you have adjusted the default settings of the tool, and wish to return to the standard properties originally installed with Optuma.
Save Settings as Default: If you have adjusted any of the tool’s properties (colour, for example) you can save the adjustments as your new default setting. Each time you apply a new NVI to a chart, the tool will display using the new settings.
Delete: Deletes the tool from the chart.
Properties
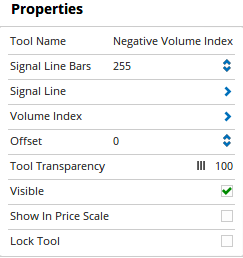 Tool Name: Allows you to adjust the name of the tool, as it’s displayed in the Structure Panel.
Signal Line Bars: The number of bars that are used in the exponential moving average signal line.
Signal Line: Expands to display the plot style properties of the signal line, such as colour, width, and transparency.
Volume Index: Expands to display the plot style properties of the signal line, such as colour, width, and transparency.
Offset:** Moves the tool forward or backwards in time. The offset is measured in bars, so a value of 2 will push the tool forward 2 bars and -2 will move the tool back 2 bars.
Tool Transparency:** Use this slider bar to adjust the transparency of the tool. Moving the slider to the left will increase the transparency of the tool.
Visible: Un-tick this checkbox to hide the tool from the chart.
Show in Price Scale: When selected, the current NVI values will be displayed in the Price Scale.
Lock Tool: When selected, any changes to the tool will be prevented from being made.