Money Flow Index
Overview
Money Flow Index is a similar indicator to the Relative Strength Index, however, the Money Flow Index uses volume to measure the strength of the money flowing in and out of the security.
Calculation
The calculation is done in the following steps.
-
For each bar, average the High, Low, and Close.
-
The MF value is equal to the Average x Volume.
-
If the value in step 1 is higher than the previous, it is considered to be a positive money value, otherwise negative. The positive money flow is then the sum of all the positive money values over the number of bars.
-
The money ratio is then + MF divided by -MF.
-
The Index is then 100 - (100 / (1 + Money Ratio)).
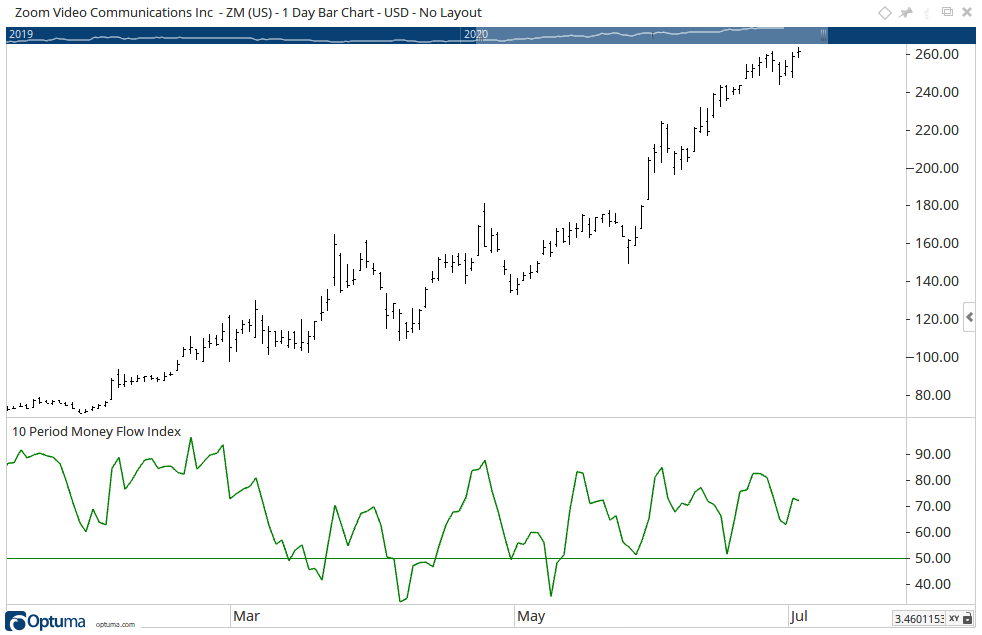
To add the tool to your chart, select the tool from the Volume tool group, and left-click on the chart to add the tool. Optuma will then draw the tool in a window below the chart using the default settings.
Scripting Function: MFI()
Actions & Properties
Actions
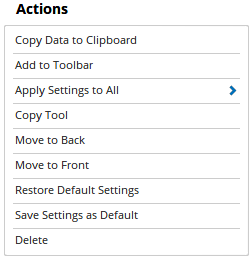
Copy Data to Clipboard: Will copy the tool’s values to the clipboard which can then be inserted into a spreadsheet, for example, allowing for further analysis.
Add to Toolbar: Adds the selected tool to your custom toolbar.
Apply Settings to All: When multiple Money Flow Index tools have been applied to a chart, page or workbook, this action can be used to apply the settings of the one selected to other instances of the tool. This is a great time saver if an adjustment is made to the tool - such as line colour - as this allows all the other Money Flow Index tools in the chart, page or entire workbook to be updated instantly.
Copy Tool: Allows you to copy the selected tool, which can then be pasted onto a different chart window.
Move to Back: If the tool is displaying in front of other tools or indicators clicking this action will move the tool view to the background.
Move to Front: If the tool is displaying behind other tools or indicators on the chart, clicking this action will bring the tool to the forefront.
Restore Default Settings: Click this action if you have adjusted the default settings of the tool, and wish to return to the standard properties originally installed with Optuma.
Save Settings as Default: If you have adjusted any of the tool’s properties (colour, for example) you can save the adjustments as your new default setting. Each time you apply a new Money Flow Index to a chart, the tool will display using the new settings.
Delete: Deletes the tool from the chart.
Properties
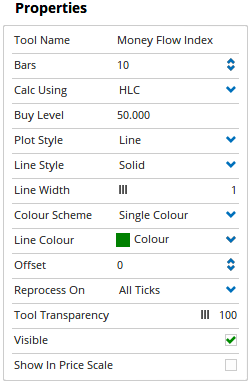
Tool Name: Allows you to adjust the name of the tool, as it’s displayed in the Structure Panel.
Bars: Allows you to increase or decrease the number of bars that are used in the calculation.
Calc Using: Sets the price data used in calculating the Money Flow Index. You can choose from Open Price, Closed Price, High Price, Low Price, HL (High + Low / 2), HLC (High + Low + Close / 3), OHLC (Open + High + Low + Close / 4), OC (Open + Close / 2), Median.
Buy Level: Sets the value of the horizontal level. Click in the field to change the level.
Plot Style: Allows you to change how the tool is displayed on your chart. There are 6 options available: Line, Dot, Histogram, Step, Shaded, Shaded Step.
Line Style: The Line Style property allows you to adjust the type of the line displayed. There are 8 options available: Solid, Dots, Dash, Dash Dots, Long Dash, Long Dash Dot, Long Dash Dot Dot, Stippled.
Line Width: Allows you to adjust the width of the line. Moving the slider bar to the right increases the thickness of the line.
Line Colour: Allows you to select the colour of the line. Clicking on the drop down arrow will display a colour swatch. Locate the desired colour and left-click it once to select it.
Fill Up / Down Barrier: When the Plot Style is set to Shaded you are able to adjust the barrier value, the default value is 0.00.
Fill Up Colour: When the Plot Style is set to Shaded you are then able to alter the Fill Colour for the tool.
Fill Down Colour: When the Plot Style is set to Shaded you are then able to alter the Fill Colour for the tool.
Transparency: Use this slider bar to adjust the transparency of the shading. Moving the slider to the left will increase the transparency.
Offset: Moves the Money Flow Index forward or backwards in time. The offset is measured in bars so a value of 2 will push the Money Flow Index forward 2 bars and -2 will move the Money Flow Index back 2 bars.
Tool Transparency: Use this slider bar to adjust the transparency of the tool. Moving the slider to the left will increase the transparency of the tool.
Visible: Un-tick this checkbox to hide the tool from the chart.
Show In Price Scale: When selected the current Money Flow Index value will be displayed in the Price Scale.