Herrick Payoff Index
Overview
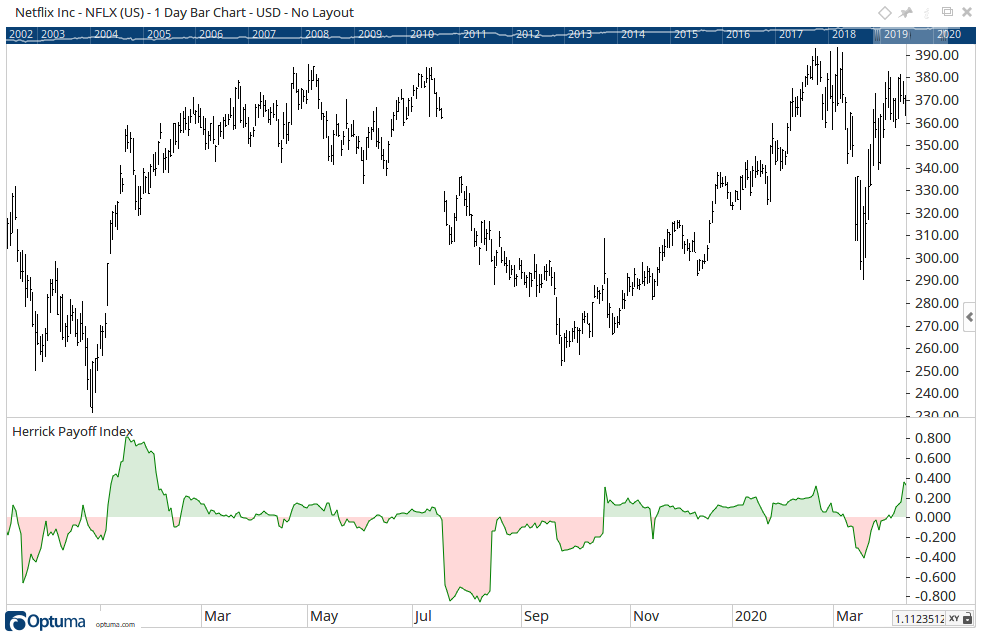
Developed by John Herrick, the Herrick Payoff Index is designed to show the amount of money flowing into (or out of) a futures contract. A value above zero represents money flowing in (bullish), below zero money flowing out (bearish).
It is important to note that this indicator makes reference to Open Interest data, so the chart you apply this to must have OI values.
To apply a Herrick Payoff Index to your chart, click the Tools menu, go to the Volume group and select the Herrick Payoff Index option. Left click once and the tool will apply along the bottom of the selected chart, in its own view.
Scripting Function: HPI()
Actions & Properties
Actions
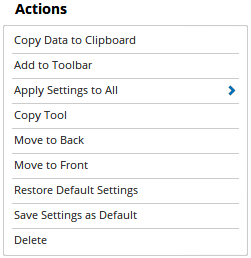
Copy Data to Clipboard: Will copy the tool’s values to the clipboard which can then be inserted into a spreadsheet, for example, allowing for further analysis.
Add to Toolbar: Adds the selected tool to your custom toolbar.
Apply Settings to All: When multiple Herrick Payoff Index tools have been applied to a chart, page or workbook, this action can be used to apply the settings of the one selected to other instances of the tool. This is a great time saver if an adjustment is made to the tool - such as line colour - as this allows all the other Herrick Payoff Index tools in the chart, page or entire workbook to be updated instantly.
Copy Tool: Allows you to copy the selected tool, which can then be pasted onto a different chart window.
Move to Back: If the tool is displaying in front of other tools or indicators clicking this action will move the tool view to the background.
Move to Front: If the tool is displaying behind other tools or indicators on the chart, clicking this action will bring the tool to the forefront.
Restore Default Settings: Click this action if you have adjusted the default settings of the tool, and wish to return to the standard properties originally installed with Optuma.
Save Settings as Default: If you have adjusted any of the tool’s properties (colour, for example) you can save the adjustments as your new default setting. Each time you apply a new Herrick Payoff Index to a chart, the tool will display using the new settings.
Delete: Deletes the tool from the chart.
Properties
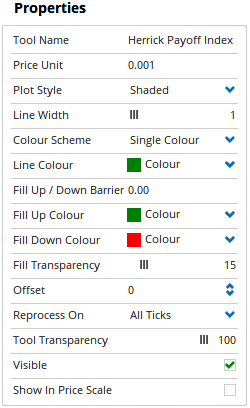
Tool Name: Allows you to adjust the name of the tool, as it’s displayed in the Structure Panel.
Plot Style: Allows you to adjust the display style of the indicator. Options included Shaded (default), Line, Dot, Histogram, Step and Shaded Step.
Line Width: Use this slider to adjust the thickness of the main indicator line.
Fill Up / Down Barrier: Set to zero by default, this setting allows you to change the value the indicators line and shaded zones changes from red (down) to green (up).
Fill Up Colour: Allows you to select the colour of the shaded zone above the selected barrier value. By default, Green is used.
Fill Down Colour: Allows you to select the colour of the shaded zone below the selected barrier value. By default, Red is used.
Fill Transparency: By default, the shaded zones will use a transparency setting of 15%, however, this can be adjusted using the slider bar.
Offset: Moves the tool forward or backwards in time. The offset is measured in bars, so a value of 2 will push the tool forward 2 bars and -2 will move the tool back 2 bars.
Tool Transparency: Use this slider bar to adjust the transparency of the tool. Moving the slider to the left will increase the transparency of the tool.
Visible: Un-tick this checkbox to hide the tool from the chart.
Show In Price Scale: When selected the current Herrick Payoff Index value will be displayed in the Price Scale.