Average Volume By Time
Overview
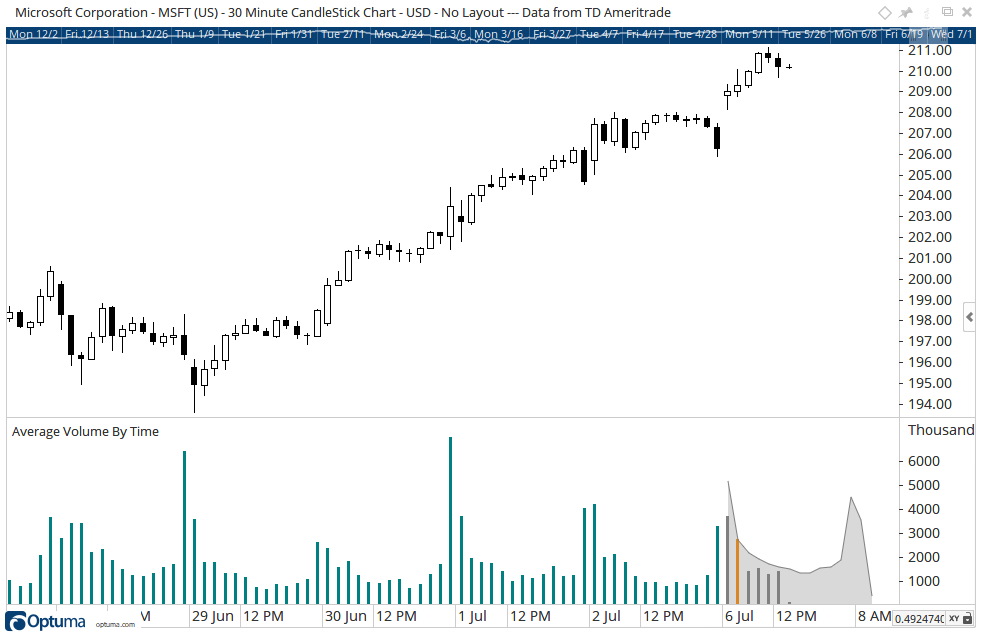
This indicator shows the current day’s volume bars compared to the same bars over a user-defined period (eg Last Month, or the visible data on the screen). Here’s an example of a 30-minute chart of Microsoft. The shaded area below the current day is the average volume over the past two weeks. The orange bar indicates where the volume is above the average for that 30 minute period.
*Note: The Average Volume By Time indicator requires an intraday data feed. Click* here *to see compatible data providers.*
To add the tool to your chart, select the tool from the Volume tool group, and left-click on the chart to add the tool. Optuma will then draw the tool in a window below the chart using the default settings.
Scripting Function: AVBT()
Actions & Properties
Actions
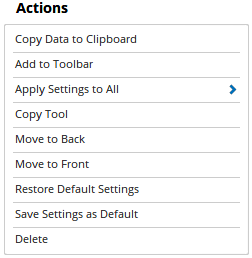
Copy Data to Clipboard: Will copy the tool’s values to the clipboard which can then be inserted into a spreadsheet, for example, allowing for further analysis.
Add to Toolbar: Adds the selected tool to your custom toolbar.
Apply Settings to All: When multiple Average Volume By Time tools have been applied to a chart, page or workbook, this action can be used to apply the settings of the one selected to other instances of the tool. This is a great time saver if an adjustment is made to the tool - such as line colour - as this allows all the other Average Volume By Time tools in the chart, page or entire workbook to be updated instantly.
Copy Tool: Allows you to copy the selected tool, which can then be pasted onto a different chart window.
Move to Back: If the tool is displaying in front of other tools or indicators clicking this action will move the tool view to the background.
Move to Front: If the tool is displaying behind other tools or indicators on the chart, clicking this action will bring the tool to the forefront.
Restore Default Settings: Click this action if you have adjusted the default settings of the tool, and wish to return to the standard properties originally installed with Optuma.
Save Settings as Default: If you have adjusted any of the tool’s properties (colour, for example) you can save the adjustments as your new default setting. Each time you apply a new Average Volume By Time to a chart, the tool will display using the new settings.
Delete: Deletes the tool from the chart.
Properties
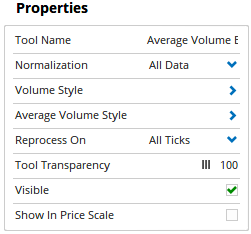
Tool Name: Allows you to adjust the name of the tool, as it’s displayed in the Structure Panel.
Normalisation: This is the amount of data used to calculate the average volume. By default, the average is calculated using all available data, but use this option to set an alternative start date or to use the left edge of the screen.
Volume Style: Allows you to adjust the style, width, and colour of the volume bars.
Average Volume Style: Allows you to adjust the style, width, and colours of the average volume.
Tool Transparency: Use this slider bar to adjust the transparency of the tool. Moving the slider to the left will increase the transparency of the tool.
Visible: Un-tick this checkbox to hide the tool from the chart.
Show in Price Scale: When selected the current value will be displayed in the Price Scale.