Linear Regression Band
Overview
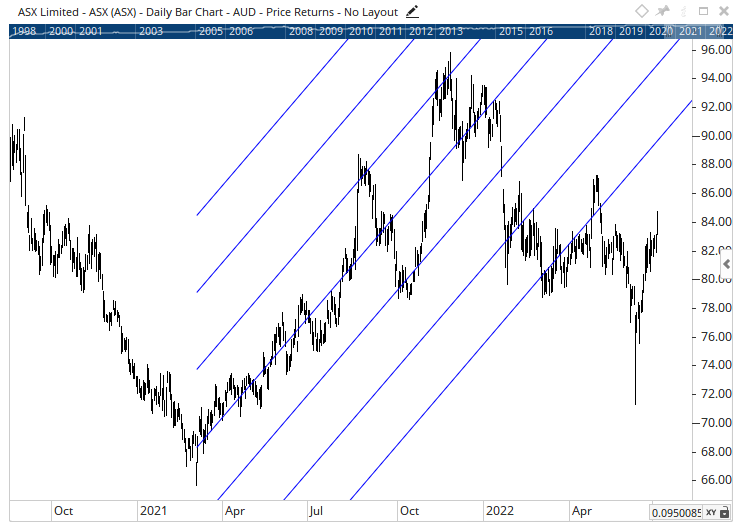
Linear Regression Bands use a complex statistical calculation called Least Squares Method to calculate the line of best fit between two user-defined points. Parallel lines are then added to either side of the central regression, based on standard deviations of that line.
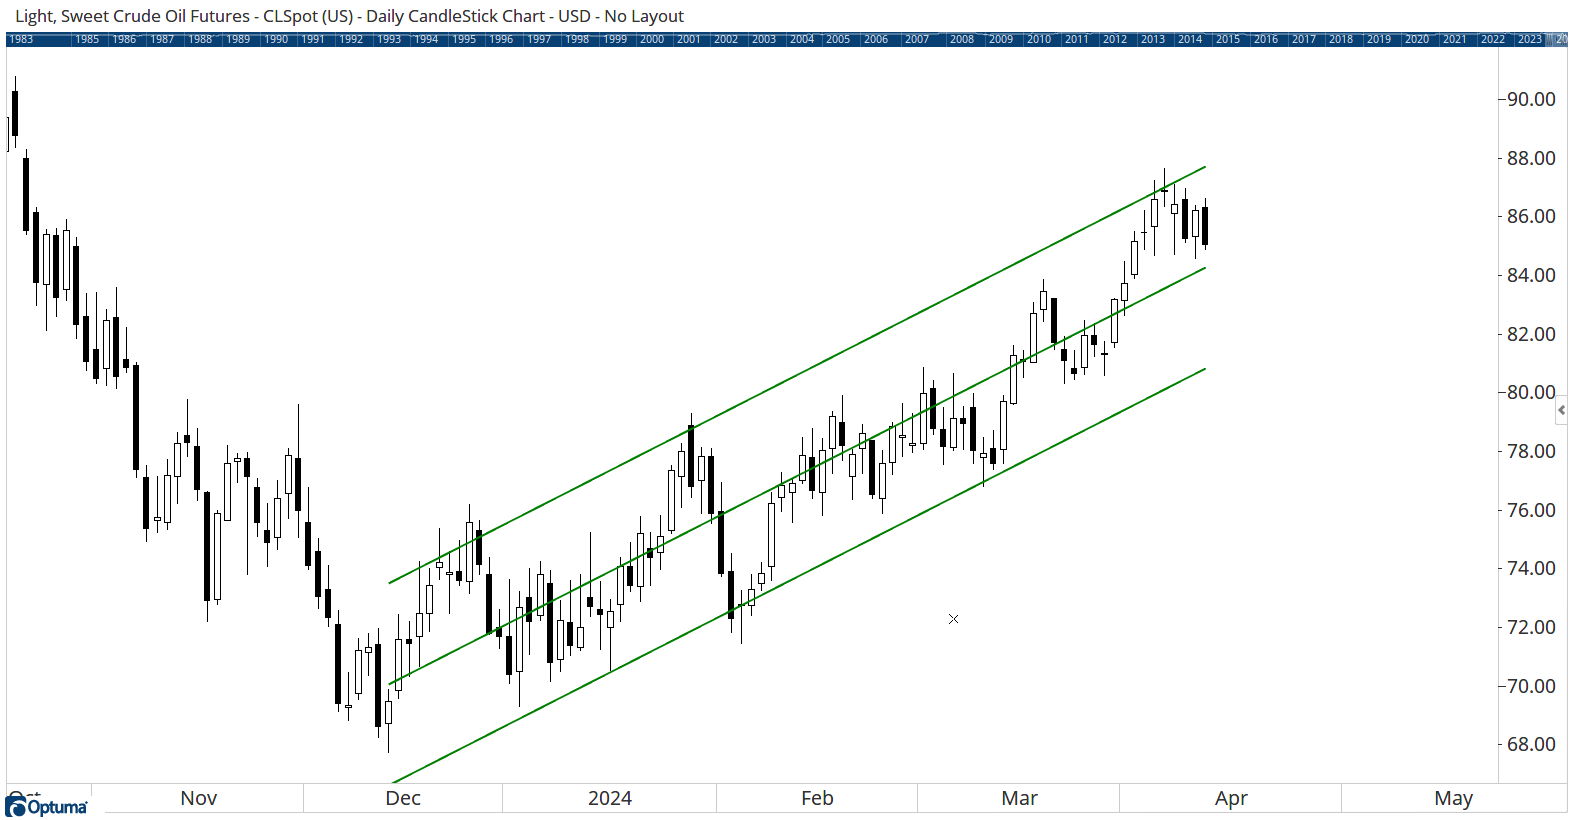
To add the tool to your chart, select it from the Statistical tool group, and left-click on the bar on the chart you wish to calculate the tool from. Next, extend the lines and left-click again where you want it to end. Optuma will then draw the tool using the default settings.
Actions & Properties
Actions
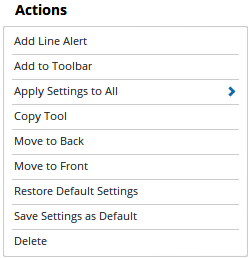
Add Line Alert: Selecting this action will set a Line Alert based on the selected line.
Add to Toolbar: Adds the selected tool to your custom toolbar.
Apply Settings to All: When multiple Linear Regression Band tools have been applied to a chart, page or workbook, this action can be used to apply the settings of the one selected to other instances of the tool. This is a great time saver if an adjustment is made to the tool - such as line colour - as this allows all the other Linear Regression Band tools in the chart, page or entire workbook to be updated instantly.
Copy Tool: Allows you to copy the selected tool, which can then be pasted onto a different chart window.
Move to Back: If the tool is displaying in front of other tools or indicators clicking this action will move the tool view to the background.
Move to Front: If the tool is displaying behind other tools or indicators on the chart, clicking this action will bring the tool to the forefront.
Restore Default Settings: Click this action if you have adjusted the default settings of the tool, and wish to return to the standard properties originally installed with Optuma.
Save Settings as Default: If you have adjusted any of the tool’s properties (colour, for example) you can save the adjustments as your new default setting. Each time you apply a new Linear Regression Band to a chart, the tool will display using the new settings.
Delete: Deletes the tool from the chart.
Properties
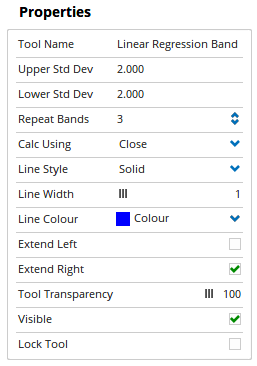
Tool Name: Allows you to adjust the name of the tool, as it’s displayed in the Structures Panel.
Upper Std Dev: The number of standard deviations to draw the upper band from the central Linear Regression line (2SDs by default).
Lower Std Dev: The number of standard deviations to draw the lower band from the central Linear Regression line (2SDs by default).
Repeat Bands: Used to repeat the bands above / below the central line.
Calc Using: This option is used to determine which components of the data are used in calculating the Linear Regression Band. You can choose from Open Price, Closed Price, High Price, Low Price, HL (High + Low / 2), HLC (High + Low + Close / 3), OHLC (Open + High + Low + Close / 4), OC (Open + Close / 2), Median.
Line Style: The Line Style property allows you to adjust the type of Band lines displayed. There are 8 options available: Solid, Dots, Dash, Dash Dots, Long Dash, Long Dash Dot, Long Dash Dot Dot, Stippled.
Line Width: Allows you to adjust the width of the Linear Regression Band lines. Moving the slider bar to the right increases the thickness of the line.
Line Colour: Allows you to adjust the colour of the Linear Regression Band lines.
Extend Left: Extends the Linear Regression Band lines to the left of the chart.
Extend Right: Extends the Linear Regression Band lines to the right of the chart.
Tool Transparency: Use this slider bar to adjust the transparency of the tool. Moving the slider to the left will increase the transparency of the tool.
Visible: Un-tick this checkbox to hide the tool from the chart.
Lock Tool: This checkbox allows you to lock the tool so that the properties position on the chart can not be altered.