Fisher Transform
Overview
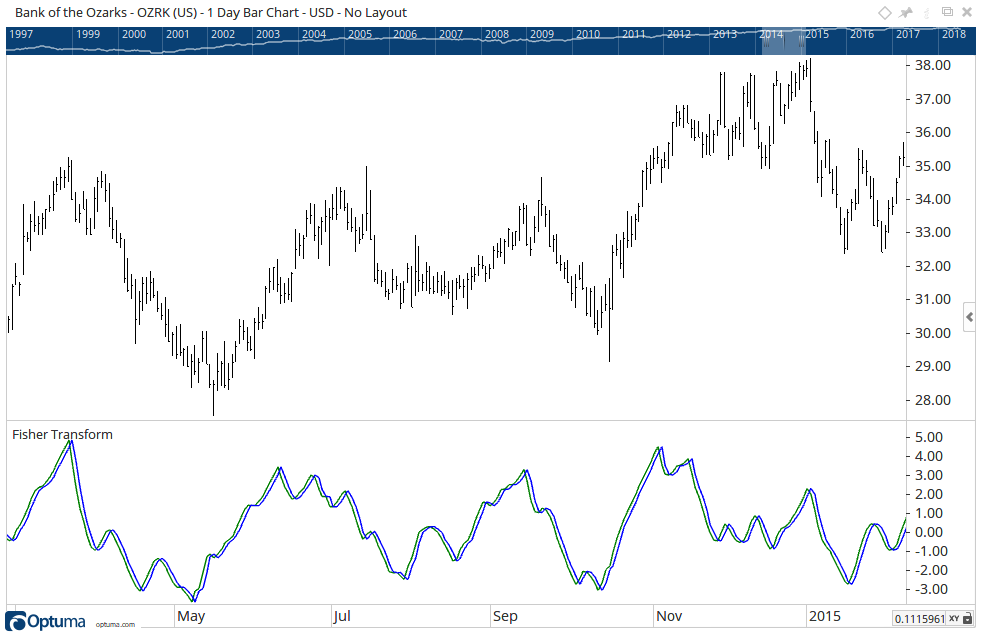
The Fisher Transform indicator is an oscillator based on complex mathematical theories (such as probability density functions) and transforms prices into sine wave that seeks to pinpoint extremes in the market. The tool is made up of a pair of lines moving above and below the central value of zero. One line is the current Fisher Transform value and the other, the trigger line. A signal, bullish or bearish, is generated when the Fisher Line crosses above or below the trigger line and/or when the indicator reaches bullish or bearish extremes.
To add the tool to your chart, select the tool from the Statistical tool group, and left-click on the chart or indicator on which you wish to add the tool. Optuma will then draw the tool using the default settings.
Scripting Function: FT()
Actions & Properties
Actions
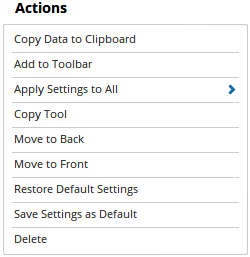
Copy Data to Clipboard: Will copy the tool’s values to the clipboard which can then be inserted into a spreadsheet, for example, allowing for further analysis.
Add to Toolbar: Adds the selected tool to your custom toolbar.
Apply Settings to All: When multiple Fisher Transform tools have been applied to a chart, page or workbook, this action can be used to apply the settings of the one selected to other instances of the tool. This is a great time saver if an adjustment is made to the tool - such as line colour - as this allows all the other Fisher Transform tools in the chart, page or entire workbook to be updated instantly.
Copy Tool: Allows you to copy the selected tool, which can then be pasted onto a different chart window.
Move to Back: If the tool is displaying in front of other tools or indicators clicking this action will move the tool view to the background.
Move to Front: If the tool is displaying behind other tools or indicators on the chart, clicking this action will bring the tool to the forefront.
Restore Default Settings: Click this action if you have adjusted the default settings of the tool, and wish to return to the standard properties originally installed with Optuma.
Save Settings as Default: If you have adjusted any of the tool’s properties (colour, for example) you can save the adjustments as your new default setting. Each time you apply a new Fisher Transform to a chart, the tool will display using the new settings.
Delete: Deletes the tool from the chart.
Properties
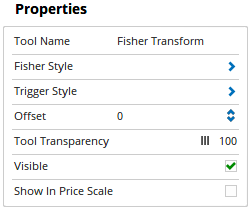
Tool Name: Allows you to adjust the name of the tool, as it’s displayed in the Structure Panel.
Fisher Style: Expands to show a number of display style options for the Fisher line. These options include Plot Style, Line Style, Line Width, Colour Scheme and Line Colour.
Trigger Style: Expands to show a number of display style options for the Trigger line. These options include Plot Style, Line Style, Line Width, Colour Scheme and Line Colour.
Offset: Moves the tool forward or backwards in time. The offset is measured in bars, so a value of 2 will push the tool forward 2 bars and -2 will move the tool back 2 bars.
Tool Transparency: Use this slider bar to adjust the transparency of the tool. Moving the slider to the left will increase the transparency of the tool.
Visible: Un-tick this checkbox to hide the tool from the chart.
Show In Price Scale: When selected the current Fisher Transform indicator value will be displayed in the Price Scale.