Exponential Regression
Overview
The Exponential Regression tool calculates the slope of a stock, allowing you to compare or rank a list of stocks. As described by Andreas Clenow, the slope of the stock is adjusted for its volatility, rewarding stocks that move up smoothly over those that are choppy.
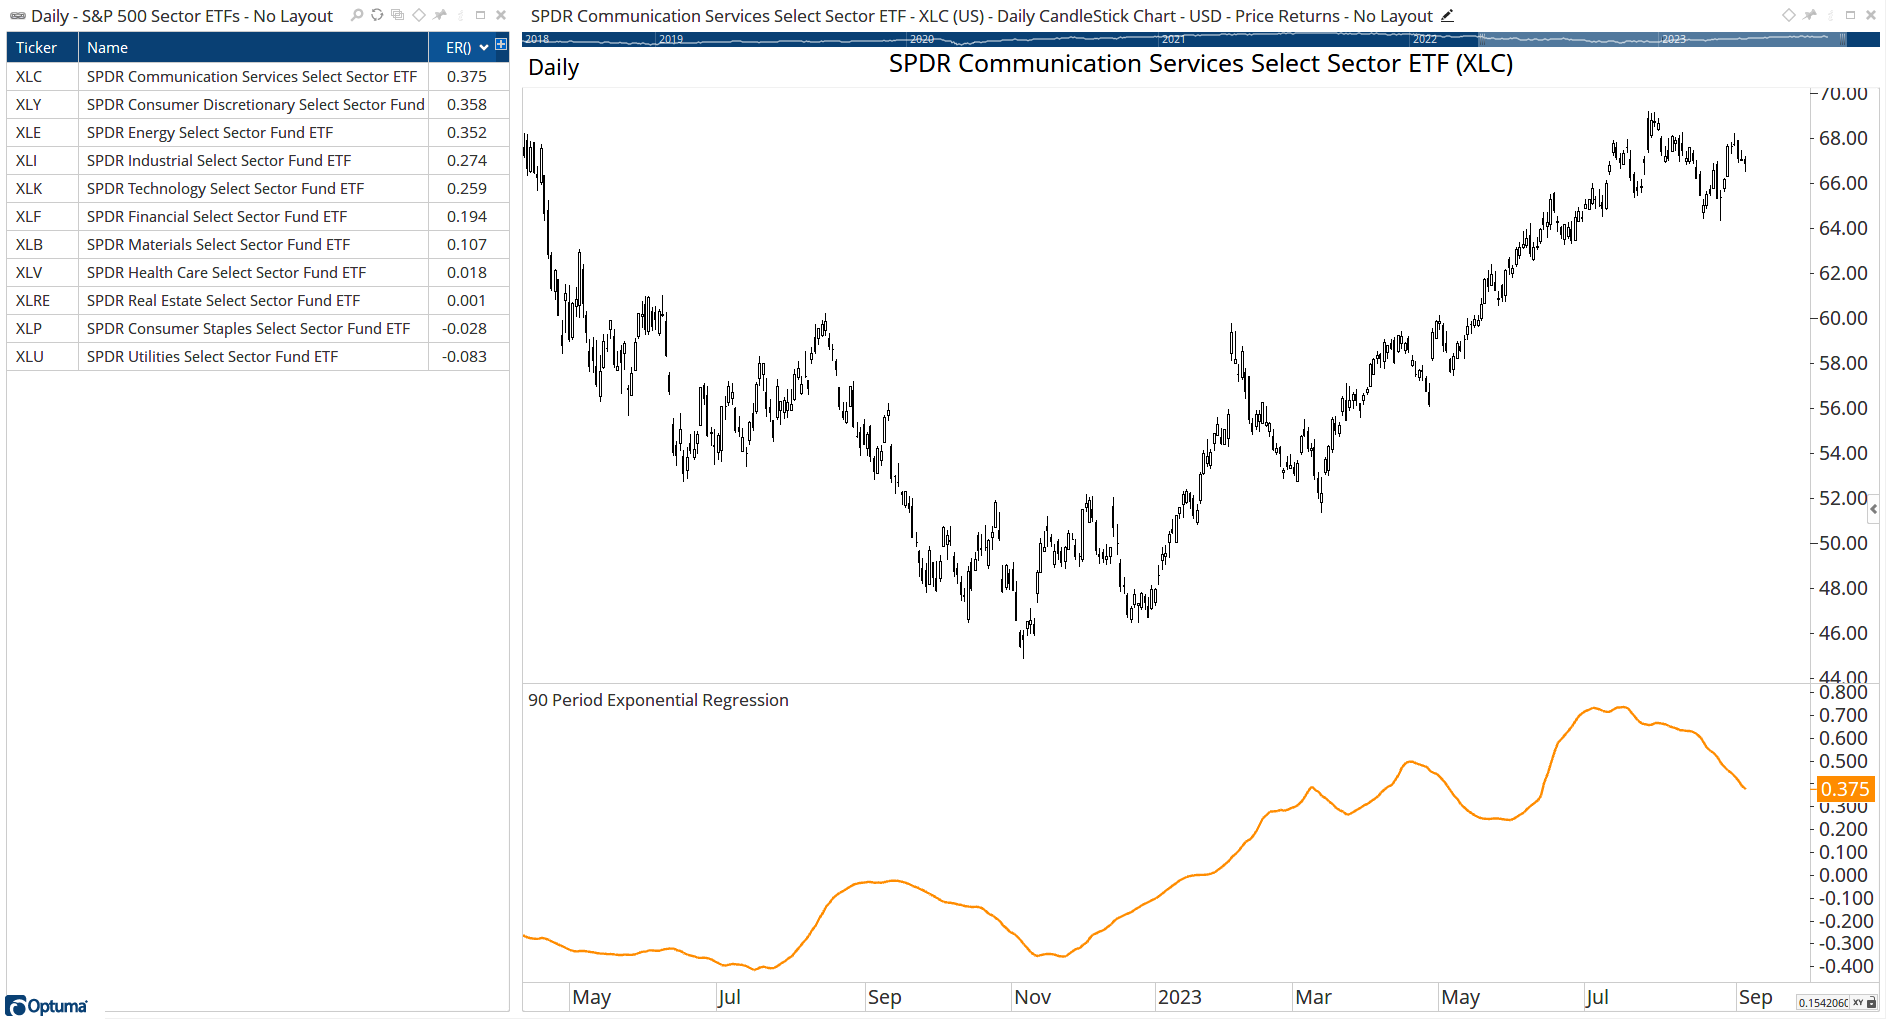
This example shows the SPDR Sector ETFs ranked by their Exponential Regression (over the last 90 days, by default). Communication Services $XLC is currently the strongest, with Utilities $XLU the weakest (a value of < 0 means the slope is negative).
To add the tool to your chart, select the tool from the Statistical tool group, and left-click on the chart to add the tool. Optuma will then draw the tool in a window below the chart using the default settings.
Scripting Function: ER()
Actions & Properties
Actions
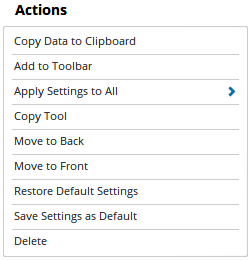
Copy Data to Clipboard: Will copy the tool’s values to the clipboard which can then be inserted into a spreadsheet, for example, allowing for further analysis.
Add to Toolbar: Adds the selected tool to your custom toolbar.
Apply Settings to All: When multiple Exponential Regression tools have been applied to a chart, page or workbook, this action can be used to apply the settings of the one selected to other instances of the tool. This is a great time saver if an adjustment is made to the tool - such as line colour - as this allows all the other Exponential Regression tools in the chart, page or entire workbook to be updated instantly.
Copy Tool: Allows you to copy the selected tool, which can then be pasted onto a different chart window.
Move to Back: If the tool is displaying in front of other tools or indicators clicking this action will move the tool view to the background.
Move to Front: If the tool is displaying behind other tools or indicators on the chart, clicking this action will bring the tool to the forefront.
Restore Default Settings: Click this action if you have adjusted the default settings of the tool, and wish to return to the standard properties originally installed with Optuma.
Save Settings as Default: If you have adjusted any of the tool’s properties (colour, for example) you can save the adjustments as your new default setting. Each time you apply a new Exponential Regression to a chart, the tool will display using the new settings.
Delete: Deletes the tool from the chart.
Properties
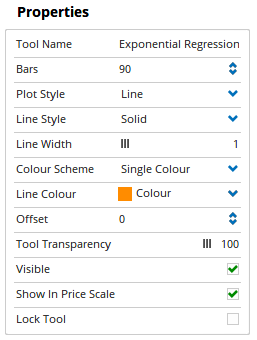
Tool Name: Allows you to adjust the name of the tool, as it’s displayed in the Structures Panel.
Bars: The number of bars that are used in the calculation of the tool.
Plot Style: There are 6 options available: Line, Dot, Histogram, Step, Shaded, Shaded Step.
Line Style: There are 8 options available: Solid, Dots, Dash, Dash Dots, Long Dash, Long Dash Dot, Long Dash Dot Dot, Stippled.
Line Width: Allows you to adjust the width of the tool. Moving the slider bar to the right increases the thickness of the line.
Colour Scheme: Allows you to select Single Colour, Copy Colours from Price Chart, Positive/Negative, or Custom.
Line Colour: Choose the line colour.
Offset: Moves the tool forward or backwards in time. The offset is measured in bars, so a value of 2 will push the tool forward 2 bars and -2 will move the tool back 2 bars.
Tool Transparency: Use this slider bar to adjust the transparency of the tool, moving the slider to the left will increase the transparency.
Visible: Un-tick this checkbox to hide the tool from the chart.
Show In Price Scale: When selected the current Linear Regression Slope value will be displayed in the Price Scale.
Lock Tool: When selected, any changes to the tool will be prevented from being made.