Williams A/D Oscillator
Overview
In 1972, Jim Waters and Larry Williams introduced a noteworthy concept known as the Accumulation / Distribution Oscillator. This innovative indicator employed a distinctive approach to gauge relative strength by defining buying power (BP) and selling power (SP) as follows:
BP1 = HIGH() - OPEN();
SP1 = CLOSE() - LOW();
HL1 = HIGH() - LOW();
(BP1 + SP1) / (2 * HL1)
These values were derived from the day’s open, high, low, and closing prices, offering insights into additional buying strength relative to the opening price and selling strength relative to the closing price. This original definition of buying and selling power remains a relevant and widely-used measure in assessing the implied direction of daily trading activities.
The Williams A/D Oscillator will display a value between 0 and 1.
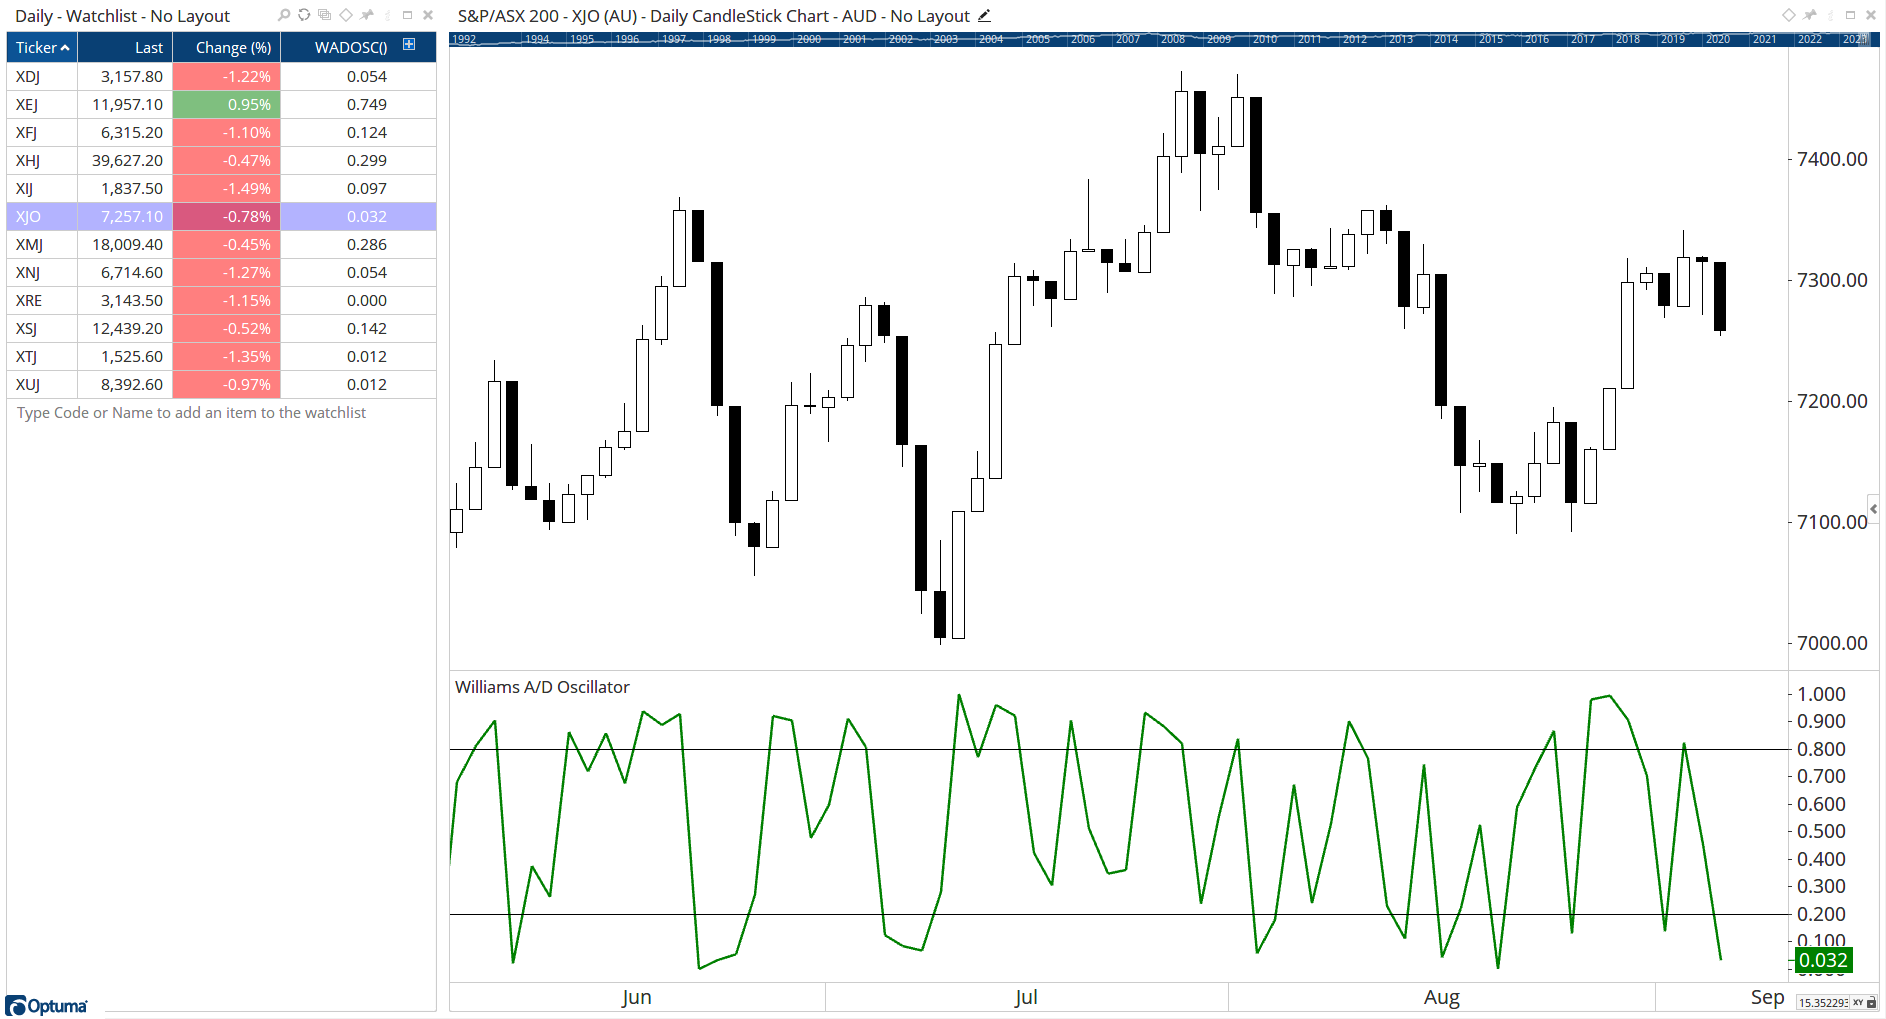
To add the tool to your chart, select the tool from the Price tool group, and left-click on the chart to add the tool. Optuma will then draw the tool in a window below the chart using the default settings.
Scripting Function: WADOSC()
Actions & Properties
Actions
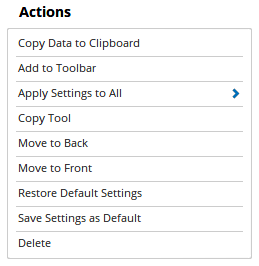
Copy Data to Clipboard: Will copy the tool’s values to the clipboard which can then be inserted into a spreadsheet, for example, allowing for further analysis.
Add to Toolbar: Adds the selected tool to your custom toolbar.
Apply Settings to All: When multiple Williams A/D Oscillator tools have been applied to a chart, page or workbook, this action can be used to apply the settings of the one selected to other instances of the tool. This is a great time saver if an adjustment is made to the tool - such as line colour - as this allows all the other Williams A/D Oscillator tools in the chart, page or entire workbook to be updated instantly.
Copy Tool: Allows you to copy the selected tool, which can then be pasted onto a different chart window.
Move to Back: If the tool is displaying in front of other tools or indicators clicking this action will move the tool view to the background.
Move to Front: If the tool is displaying behind other tools or indicators on the chart, clicking this action will bring the tool to the forefront.
Restore Default Settings: Click this action if you have adjusted the default settings of the tool, and wish to return to the standard properties originally installed with Optuma.
Save Settings as Default: If you have adjusted any of the tool’s properties (colour, for example) you can save the adjustments as your new default setting. Each time you apply a new Williams A/D Oscillator to a chart, the tool will display using the new settings.
Delete: Deletes the tool from the chart.
Properties
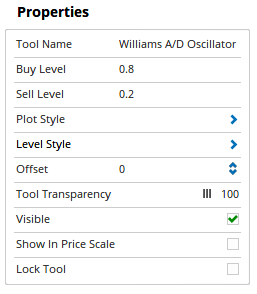
Tool Name: Allows you to adjust the name of the tool, as it’s displayed in the Structure Panel.
Buy Level: Displays a Horizontal Line on the Williams A/D Oscillator window at a value of 0.8 by default, however manual values can be entered here.
Sell Level: Displays a Horizontal Line on the Williams A/D Oscillator window at a value of 0.2 by default, however manual values can be entered here.
Plot Style: Adjusts the display style of the Williams A/D Oscillator tool. There are 6 options available: Line, Dot, Histogram, Step, Shaded, Shaded Step.
Line Style: Controls the display properties of the Buy and Sell lines. There are 8 options available: Solid, Dots, Dash, Dash Dots, Long Dash, Long Dash Dot, Long Dash Dot Dot, Stippled
- Line Width - Allows you to adjust the width of the Oscillator tool. Moving the slider bar to the right increases the thickness of the line.
- Line Colour - Allows you to adjust the colour of the Oscillator tool.
- Transparency - Use this slider bar to adjust the transparency level of the Buy and Sell Lines.
- Visible - Untick this checkbox to hide the Buy and Sell lines from the indicator window.
Offset: Moves the tool forward or backwards in time. The offset is measured in bars, so a value of 2 will push the tool forward 2 bars and -2 will move the tool back 2 bars.
Tool Transparency: Use this slider bar to adjust the transparency of the tool. Moving the slider to the left will increase the transparency of the tool.
Visible: Un-tick this checkbox to hide the tool from the chart.
Show in Price Scale: When selected the current Williams A/D Oscillator value will be displayed in the Price Scale.
Lock Tool: When selected, any changes to the tool will be prevented from being made.