Darvas Boxes
Overview
The Darvas trading technique is designed as a method of capturing the strength of the trend. The buy signals are generated on new bullish strength and managed by using the five-day volatility range to set a stop loss.
The Darvas approach is built around long-term trend trading. It is a bullish approach that is most suited to trending stocks, and also to trending markets. Darvas was able to follow and trade stocks without the need for intra-day prices, or to be constantly in front of a screen, or even to have access to daily prices. This makes the approach particularly useful for readers who have full-time jobs. Darvas applies a filter - a Darvas box (DB) - to price movements to help determine which price moves are significant, and which are not. The filter is established by upper and lower limits of a Darvas box.
The top of the Darvas box always starts with a new high. This high must be followed by 3 days that are lower. The bottom of the Darvas box can only be calculated after the top of the Darvas box has been confirmed. It is constructed in the opposite way to the top of the box. It uses as its starting point the lowest low that occurs AFTER the top of the Darvas box is established. It is again a 4-day pattern, but it starts 1 day after the top of the box pattern. This means it takes a minimum of 5 days for a Darvas box to be identified for both top and bottom.
The Darvas tool automatically plots the Darvas box from any user-selected high point.
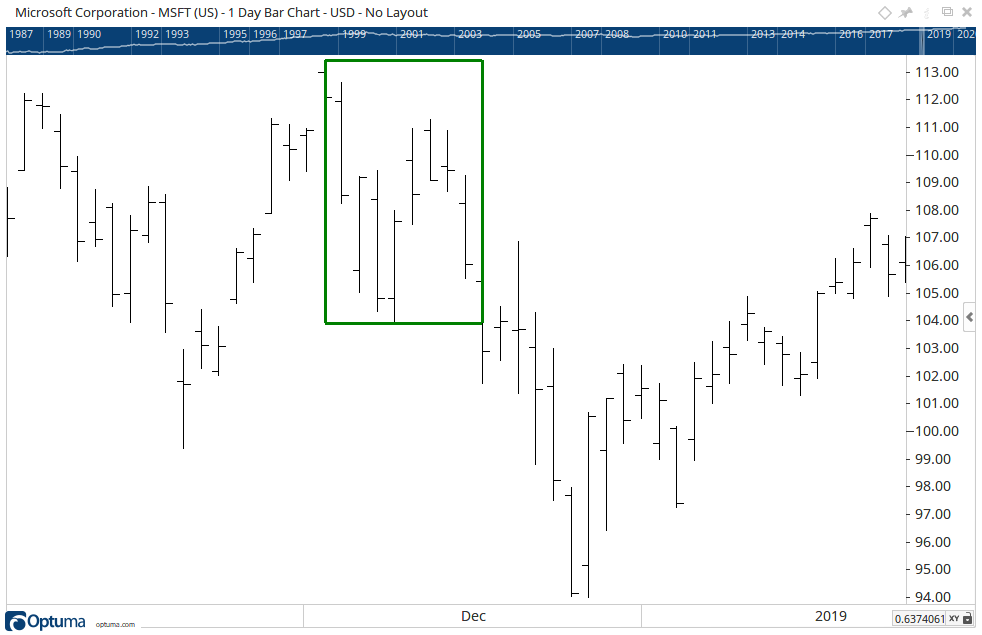
To add the tool to your chart, select the tool from the Guppy tool group, and left-click on the bar on the chart you wish to calculate the tool from. Optuma will then draw the tool using the default settings.
Scripting Function: DARVASBOXSCAN()
Actions & Properties
Actions
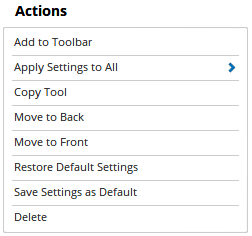
Add to Toolbar: Adds the selected tool to your custom toolbar.
Apply Settings to All: When multiple Darvas Boxes tools have been applied to a chart, page or workbook, this action can be used to apply the settings of the one selected to other instances of the tool. This is a great time saver if an adjustment is made to the tool - such as line colour - as this allows all the other Darvas Boxes tools in the chart, page or entire workbook to be updated instantly.
Copy Tool: Allows you to copy the selected tool, which can then be pasted onto a different chart window.
Move to Back: If the tool is displaying in front of other tools or indicators clicking this action will move the tool view to the background.
Move to Front: If the tool is displaying behind other tools or indicators on the chart, clicking this action will bring the tool to the forefront.
Restore Default Settings: Click this action if you have adjusted the default settings of the tool, and wish to return to the standard properties originally installed with Optuma.
Save Settings as Default: If you have adjusted any of the tool’s properties (colour, for example) you can save the adjustments as your new default setting. Each time you apply a new Darvas Boxes to a chart, the tool will display using the new settings.
Delete: Deletes the tool from the chart.
Properties
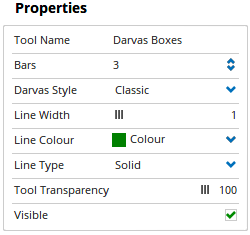
Tool Name: Allows you to adjust the name of the tool, as it’s displayed in the Structure Panel.
Bars: Sets how many bars are used in calculating the Darvas Box. Click in this field to change this setting.
Darvas Style: Select from a drop down menu either Modern or Classic style.
Line Width: Allows you to adjust the width of the Darvas Box lines. Moving the slider bar to the right increases the thickness of the line.
Line Colour:** Allows you to select the colour of the Darvas Box lines. Clicking on the drop down arrow will display a colour swatch. Locate the desired colour and left-click it once to select it.
**Line Type:** The Line Type allows you to adjust the type of the line displayed. There are 8 options available: Solid, Dots, Dash, Dash Dots, Long Dash, Long Dash Dot, Long Dash Dot Dot, Stippled.
Tool Transparency: Use this slider bar to adjust the transparency of the tool. Moving the slider to the left will increase the transparency of the tool.
Visible: Un-tick this checkbox to hide the tool from the chart.
More Information
For further information relating to the application of this tool, visit Guppy Traders.