Circle
Overview
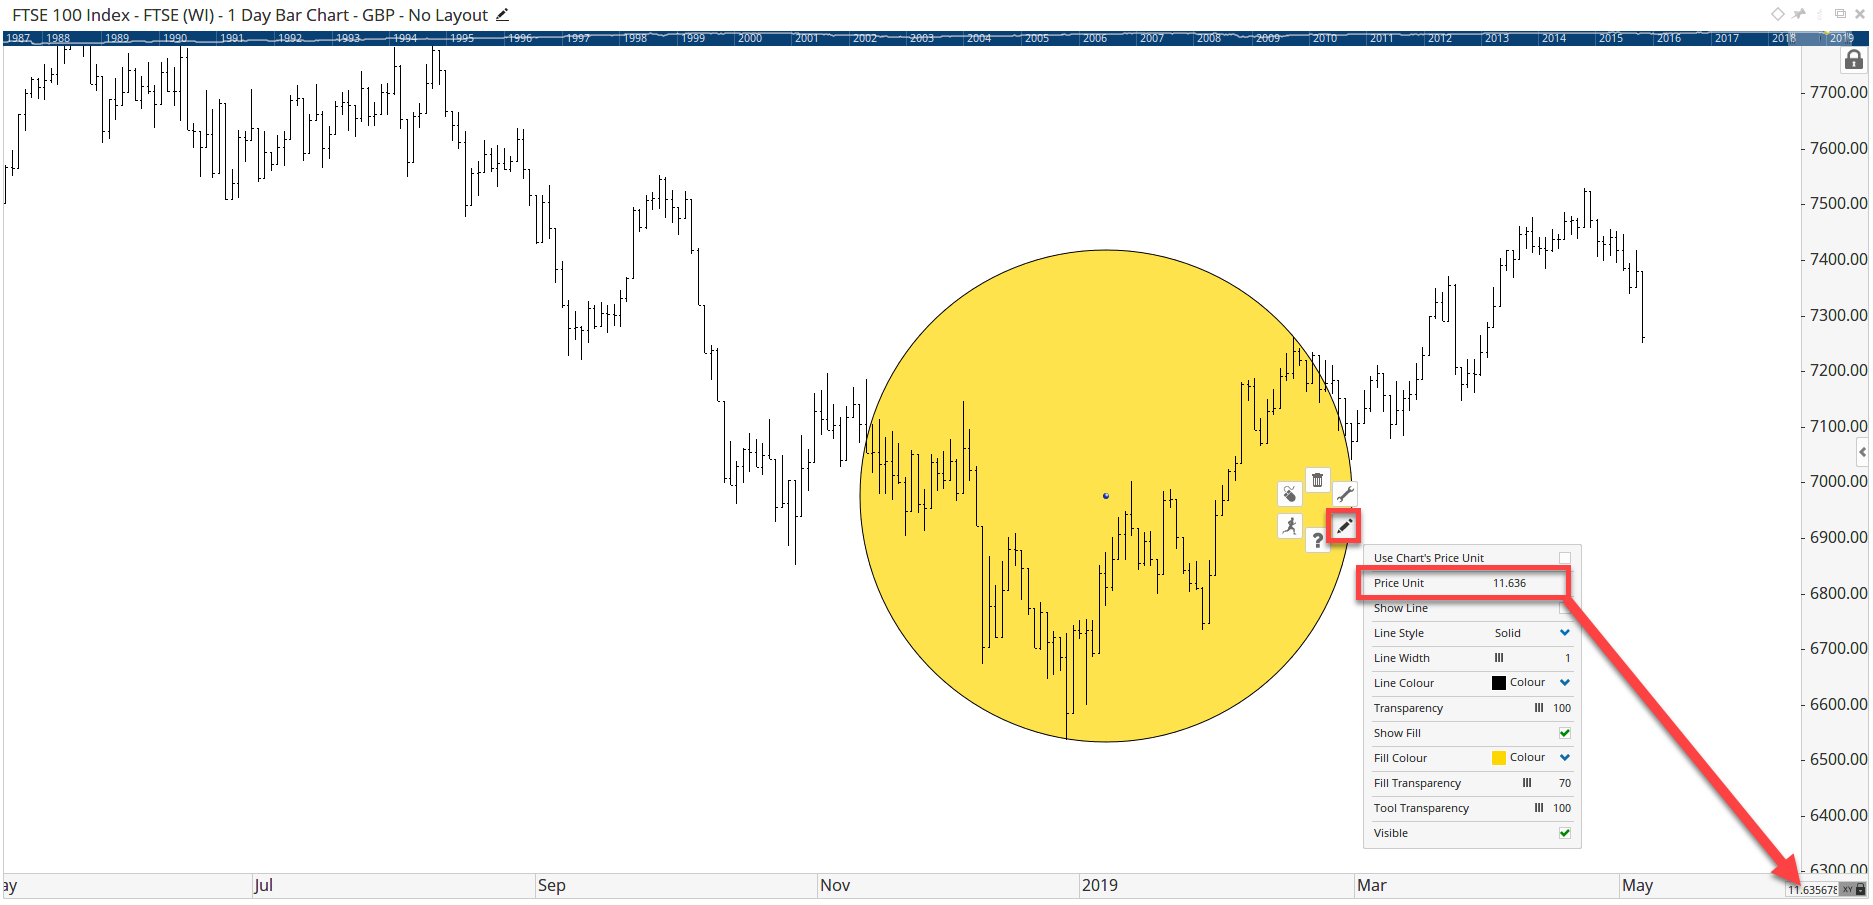
The Circle tool allows you to apply a circle onto a chart, this can be used to identify curved trends in the market. Note that the tool uses the chart’s Time/Price Ratio in its calculation, so you may wish to use the Geometric Circle tool instead.
To add the Circle to a chart:
-
Select the Circle tool from the Drawing tool group. The mouse pointer will change into a pencil.
-
Left-click on a point where you wish to start drawing the Circle.
-
Move your mouse pointer to the second desired point and left-click to place the circle on the chart.
-
Adjust the tool’s Price Unit as required.
Actions & Properties
Actions
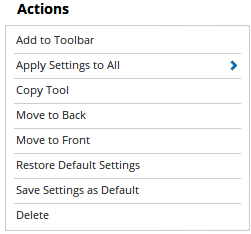
Add to Toolbar: Adds the selected tool to your custom toolbar.
Apply Settings to All: When multiple Circle tools have been applied to a chart, page or workbook, this action can be used to apply the settings of the one selected to other instances of the tool. This is a great time saver if an adjustment is made to the tool - such as line colour - as this allows all the other Circle tools in the chart, page or entire workbook to be updated instantly.
Copy Tool: Allows you to copy the selected tool, which can then be pasted onto a different chart window.
Move to Back: If the tool is displaying in front of other tools or indicators clicking this action will move the tool view to the background.
Move to Front: If the tool is displaying behind other tools or indicators on the chart, clicking this action will bring the tool to the forefront.
Restore Default Settings: Click this action if you have adjusted the default settings of the tool, and wish to return to the standard properties originally installed with Optuma.
Save Settings as Default: If you have adjusted any of the tool’s properties (colour, for example) you can save the adjustments as your new default setting. Each time you apply a new Circle to a chart, the tool will display using the new settings.
Delete: Deletes the tool from the chart.
Properties
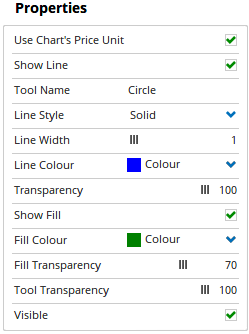
Use Chart’s Price Unit: Selecting this item will use the price unit of the chart in the tool calculation.
Price Unit: When Use Chart’s Price Unit is deselected this option becomes available to allow manual adjustment of the Price unit interval for the tool to use.
Show Line: Allows you to adjust whether or not a line is displayed from the central point of the circle to the outer edge.
Tool Name: Allows you to adjust the name of the tool, as it’s displayed in the Structure Panel.
Line Style: Change the line type used to draw the radius line. There are 8 options available: Solid, Dots, Dash, Dash Dots, Long Dash, Long Dash Dot, Long Dash Dot Dot, Stippled.
Line Width: Allows you to adjust the width of the tool’s line. Moving the slider bar to the right increases the thickness of the line.
Line Colour: Allows you to select the colour of the tools line. Clicking on the drop down arrow will display a colour swatch. Locate the desired colour and left-click it once to select it.
Transparency: Use this slider bar to adjust the transparency of the tool line. Moving the slider to the left will increase the transparency of the tool.
Fill Colour: Sets the shading colour of the Circle.
Fill Transparency: Use this field to make the Circle shading transparent. Moving the slider to the left will increase the transparency of the tool.
Tool Transparency: Use this slider bar to adjust the transparency of the tool (both shading and line components). Moving the slider to the left will increase the transparency of the tool.
Visible: Un-tick this checkbox to hide the tool from the chart.