Day of Month
Overview
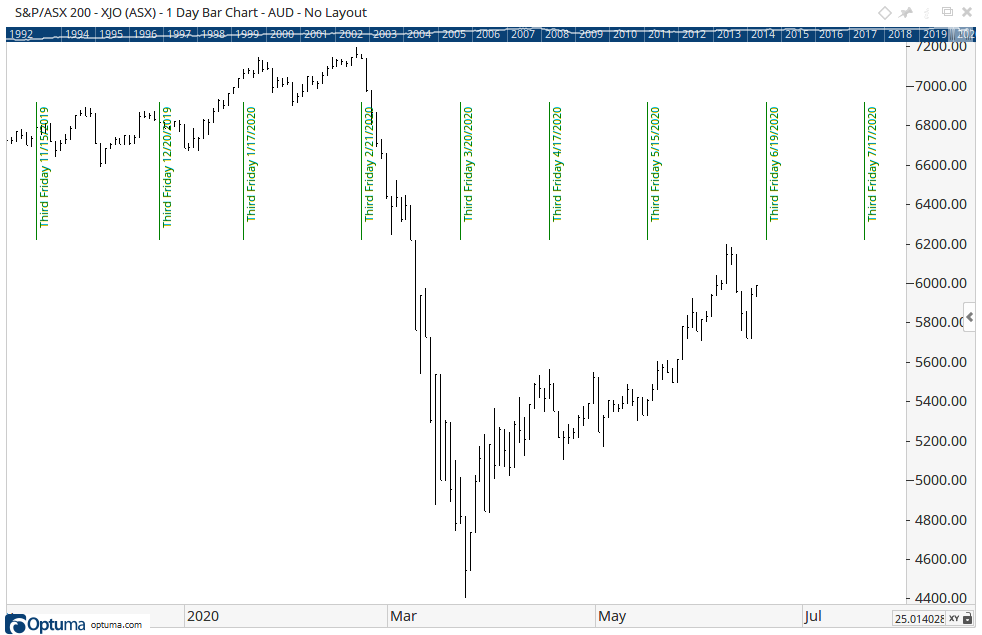
By default, the Day of Month tool will select the 3rd Friday of the month (the day that most options expire) and draw a vertical line on the chart.
To add the tool to your chart, select the tool from the Cycles tool group, and left-click on the chart or indicator on which you wish to add the tool. Optuma will then draw the tool using the default settings.
Actions & Properties
Actions
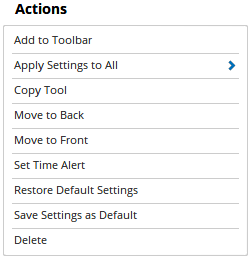
Add to Toolbar: Adds the selected tool to your custom toolbar.
Apply Settings to All: When multiple Day of Month tools have been applied to a chart, page or workbook, this action can be used to apply the settings of the one selected to other instances of the tool. This is a great time saver if an adjustment is made to the tool - such as line colour - as this allows all the other Day of Month tools in the chart, page or entire workbook to be updated instantly.
Copy Tool: Allows you to copy the selected tool, which can then be pasted onto a different chart window.
Move to Back: If the tool is displaying in front of other tools or indicators clicking this action will move the tool view to the background.
Move to Front: If the tool is displaying behind other tools or indicators on the chart, clicking this action will bring the tool to the forefront.
Set Time Alert: Selecting this action will set a Time Alert at the value the Vertical Line is positioned.
Restore Default Settings: Click this action if you have adjusted the default settings of the tool, and wish to return to the standard properties originally installed with Optuma.
Save Settings as Default: If you have adjusted any of the tool’s properties (colour, for example) you can save the adjustments as your new default setting. Each time you apply a new Day of Month to a chart, the tool will display using the new settings.
Delete: Deletes the tool from the chart.
Properties
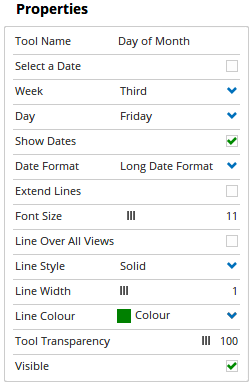
Tool Name: Allows you to adjust the name of the tool, as it’s displayed in the Structure Panel.
Select a Date: Check this checkbox if you would like the Day of the Month tool to display a line on an exact day of each month (25th for example).
Week: Allows you to select which week of the month the Day of the Month tool applies to (1st, 2nd, 3rd or 4th).
Day: Allows you to select which day within the selected week the Day of the Month tool applies to (Monday to Friday).
Show Dates: Untick this checkbox to hide the date label of the tool.
Date Format: Can nominate to display the date label in long or short format.
Extend Lines: Check this box and the Day of the Month lines will automatically extend from the top to the bottom of the chart. Uncheck this box to manually define the length of the lines. Click on one of the small squares that appear on the tool when selected, and then drag that square up or down in order to set the line length.
Font Size: Use this slider bar to adjust the size of the font used on the text labels. Sliding the bar to the right will increase the size of the text.
Line Over All Views: Check this box and the Day of the Month lines will extend to display over any tools that are displayed in a separate indicator window, for example, Volume.
Line Style: The Line Style property allows you to adjust the type of the line displayed. There are 8 options available: Solid, Dots, Dash, Dash Dots, Long Dash, Long Dash Dot, Long Dash Dot Dot, Stippled.
Line Width: Allows you to adjust the width of the line. Moving the slider bar to the right increases the thickness of the line.
Line Colour: Allows you to select the colour of the line. Clicking on the drop down arrow will display a colour swatch. Locate the desired colour and left-click it once to select it.
Tool Transparency: Use this slider bar to adjust the transparency of the tool. Moving the slider to the left will increase the transparency of the tool.
Visible: Un-tick this checkbox to hide the tool from the chart.