Calendar Day Intervals
Overview
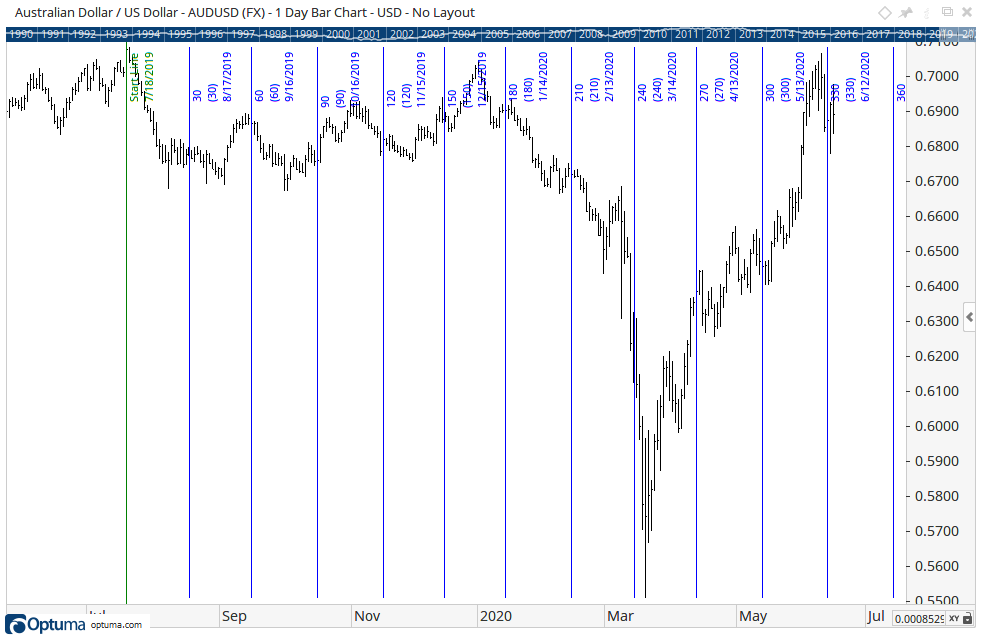
The Calendar Day Intervals tool creates a number of vertical lines on the chart based on a user-specified number of calendar days from a specified starting point.
See also Trading Day Intervals.
The example below shows 30 calendar day intervals from the 2019 high in green.
To add the tool to your chart, select the tool from the Cycles tool group, and left-click on the bar on the chart you wish to calculate the tool from. Optuma will then draw the tool using the default settings.
Actions & Properties
Actions
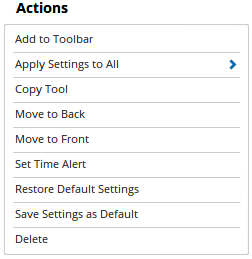
Add to Toolbar: Adds the selected tool to your custom toolbar.
Apply Settings to All: When multiple Calendar Day Intervals tools have been applied to a chart, page or workbook, this action can be used to apply the settings of the one selected to other instances of the tool. This is a great time saver if an adjustment is made to the tool - such as line colour - as this allows all the other Calendar Day Intervals tools in the chart, page or entire workbook to be updated instantly.
Copy Tool: Allows you to copy the selected tool, which can then be pasted onto a different chart window.
Move to Back: If the tool is displaying in front of other tools or indicators clicking this action will move the tool view to the background.
Move to Front: If the tool is displaying behind other tools or indicators on the chart, clicking this action will bring the tool to the forefront.
Set Time Alert: Selecting this action will set a Time Alert at the value the Vertical Line is positioned.
Restore Default Settings: Click this action if you have adjusted the default settings of the tool, and wish to return to the standard properties originally installed with Optuma.
Save Settings as Default: If you have adjusted any of the tool’s properties (colour, for example) you can save the adjustments as your new default setting. Each time you apply a new Calendar Day Intervals to a chart, the tool will display using the new settings.
Delete: Deletes the tool from the chart.
Properties
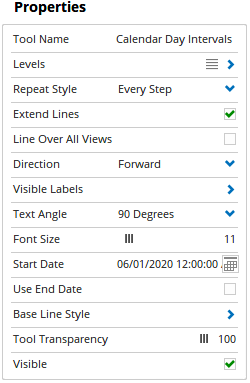
Tool Name: Allows you to adjust the name of the tool, as it’s displayed in the Structure Panel.
Levels: Click on this option to display the different Calendar Day Intervals levels. To add a new level to the chart, left-click on the blue (+) button and enter the values as needed.
- Value (Days) - Sets the day value for Calendar Day Intervals. To change the value amount, click in the field and enter the new value.
- Line Style - Sets the line type, thickness, colour and transparency of the Calendar Day Intervals lines.
- Visible - To hide a level, deselect the check box with the green tick.
Repeat Style: Alters how the intervals are repeated, can be set to Every Step, First Step or All Exact Steps.
Extend Lines: Check this box and the Calendar Day Interval lines will automatically extend from the top to the bottom of the chart. Uncheck this box to manually define the length of the interval lines. Click on one of the small squares that appear on the tool when selected, and then drag that square up or down in order to set the line length.
Line Over All Views: Check this box and the Calendar Day Interval lines will extend to display over any tools that are displayed in a separate indicator window, for example, Volume.
Direction: The interval lines can be set to display either forward, reverse or both directions from the start line.
Visible Labels: Nominate whether only date or price information (or both) are displayed for each interval.
Text Angle: Option to display text for the date labels either in vertical or horizontal format.
Font Size: Adjusts the size of the interval label, moving the slider bar to the right will increase the font size.
Use End Date: When the Use End Date is selected the End Date option is made available. With this option, you can specify a date for the Calendar Day Intervals to stop at. If this option is not selected the Calendar Day Intervals will be drawn on into the future to the end of the chart.
Base Line Style: This option expands to show the following:
- Line Style - The Line Style property allows you to adjust the type of the start/anchor line displayed. There are 8 options available: Solid, Dots, Dash, Dash Dots, Long Dash, Long Dash Dot, Long Dash Dot Dot, Stippled.
- Line Width - Allows you to adjust the width of the start/anchor lines. Moving the slider bar to the right increases the thickness of the line.
- Line Colour - Allows you to select the colour of the start/anchor line. Clicking on the drop down arrow will display a colour swatch. Locate the desired colour and left-click it once to select it.
- Transparency - Use this slider bar to adjust the transparency of the start/anchor line. Moving the slider to the left will increase the transparency of the tool.
- Visible - Un-tick this checkbox to hide the start/anchor from the chart.
Tool Transparency: Use this slider bar to adjust the transparency of the tool. Moving the slider to the left will increase the transparency of the tool.
Visible: Un-tick this checkbox to hide the tool from the chart.