Variable Index Dynamic Average
Overview
The variable index dynamic average (VIDYA) was developed by Tushar Chande as an overall improvement over the exponential moving average. It is an adaptive moving average, which means that it not only smooths the price but also adapts to market volatility. It uses the Chande Momentum Oscillator for the volatility calculation.
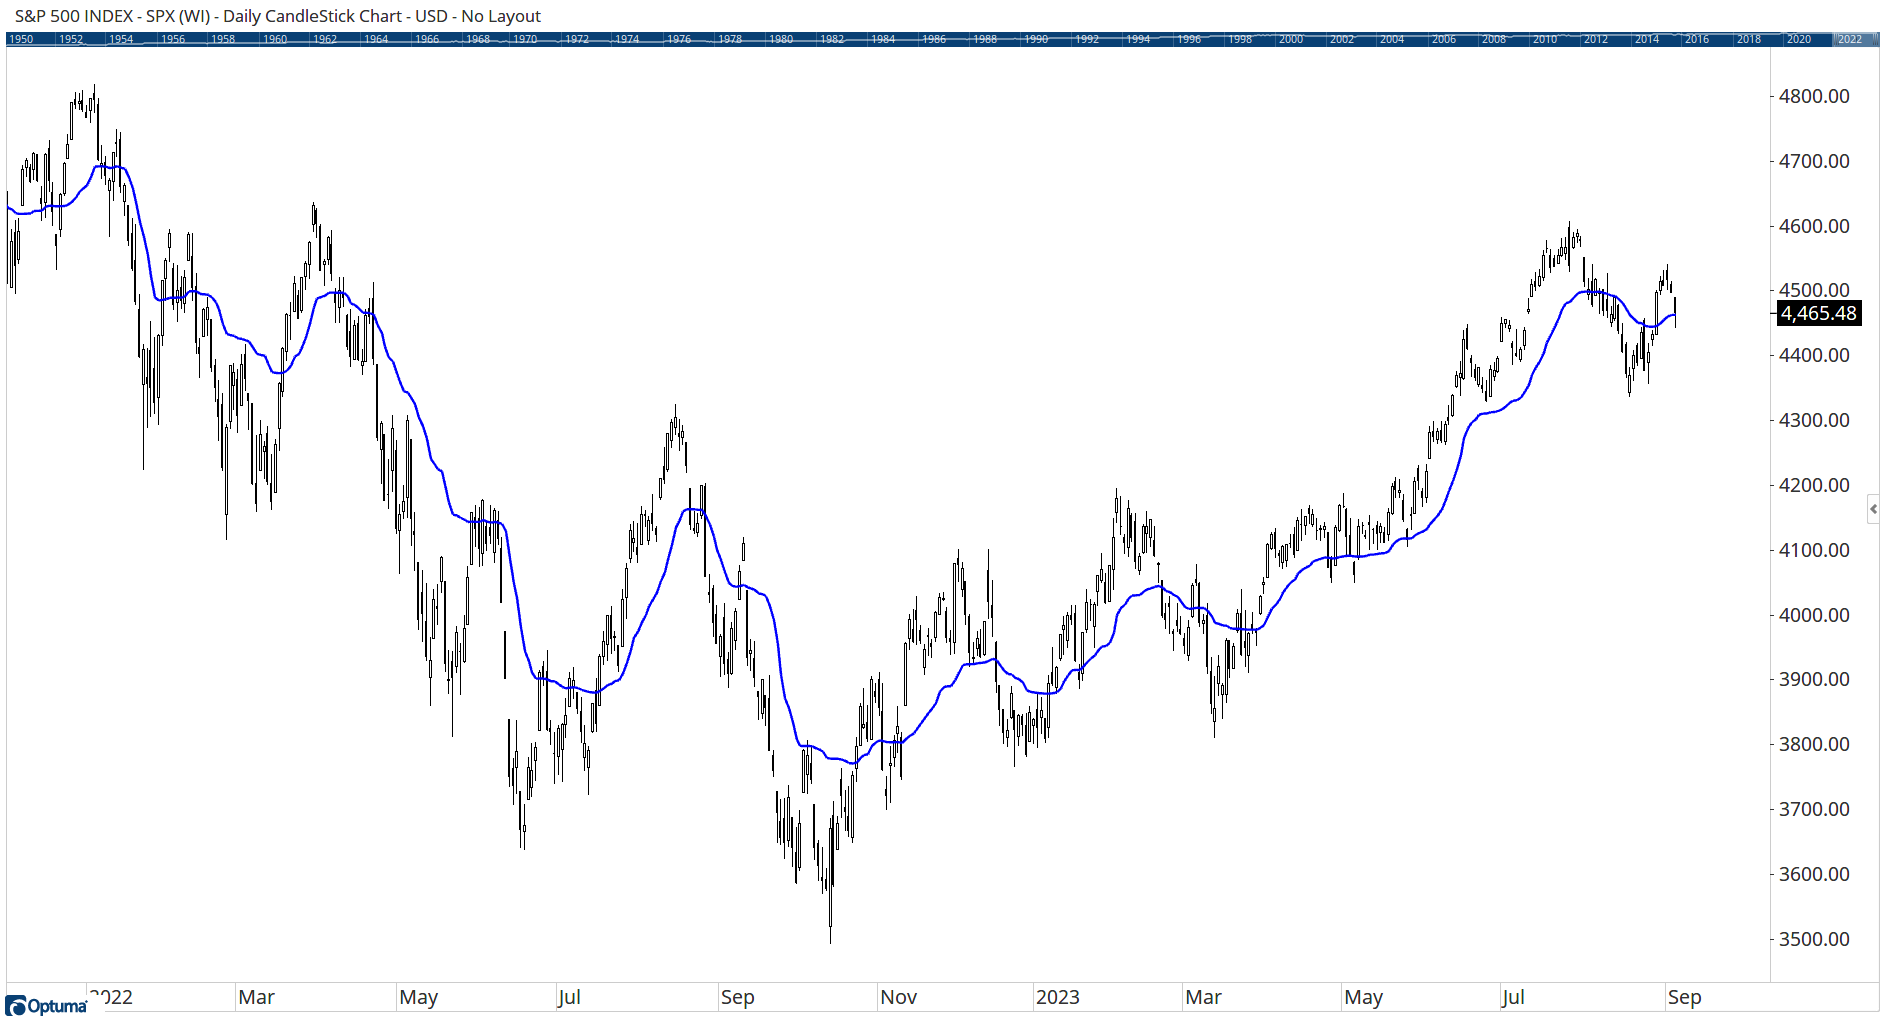
To add the tool to your chart, select the tool from the Averages tool group, and left-click on the chart to add the tool. Optuma will then draw the tool in a window below the chart using the default settings.
Scripting Function: VIDYA()
Actions & Properties
Actions
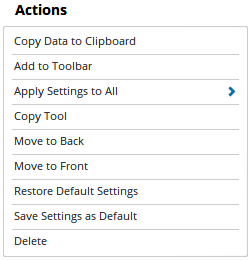
Copy Data to Clipboard: Will copy the tool’s values to the clipboard which can then be inserted into a spreadsheet, for example, allowing for further analysis.
Add to Toolbar: Adds the selected tool to your custom toolbar.
Apply Settings to All: When multiple tools have been applied to a chart, page or workbook, this action can be used to apply the settings of the one selected to other instances of the tool. This is a great time saver if an adjustment is made to the tool - such as line colour - as this allows all the other VIDYA tools in the chart, page or entire workbook to be updated instantly.
Copy Tool: Allows you to copy the selected tool, which can then be pasted onto a different chart window.
Move to Back: If the tool is displaying in front of other tools or indicators clicking this action will move the tool view to the background.
Move to Front: If the tool is displaying behind other tools or indicators on the chart, clicking this action will bring the tool to the forefront.
Restore Default Settings: Click this action if you have adjusted the default settings of the tool, and wish to return to the standard properties originally installed with Optuma.
Save Settings as Default: If you have adjusted any of the tool’s properties (colour, for example) you can save the adjustments as your new default setting. Each time you apply a new VIDYA to a chart, the tool will display using the new settings.
Delete: Deletes the tool from the chart.
Properties
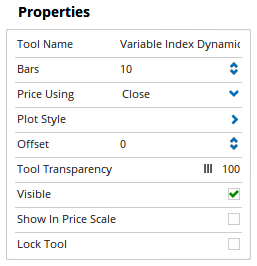
Tool Name: Allows you to adjust the name of the tool, as it’s displayed in the Structures Panel.
Bars: The number of bars that are used in the calculation of the tool.
Price Using: Set to Close by default, but allows for different calculations, eg HL Average, Median, OHLC Average.
Plot Style: Allows the Line type, style, width, and colour to be changed.
Offset: Moves the tool forward or backwards in time. The offset is measured in bars, so a value of 2 will push the tool forward 2 bars and -2 will move the tool back 2 bars.
Tool Transparency: Use this slider bar to adjust the transparency of the tool, moving the slider to the left will increase the transparency.
Visible: Un-tick this checkbox to hide the tool from the chart.
Show In Price Scale: When selected the current VIDYA value will be displayed in the Price Scale.
Lock Tool: When selected, any changes to the tool will be prevented from being made.