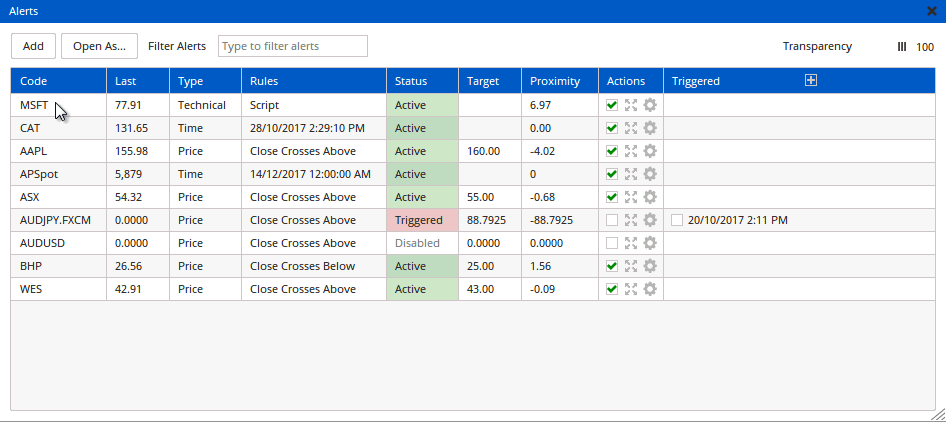
Alert Manager
Overview
The Alerts Manager allows the user to manage previously created alerts. It is also possible to create new Price or Technical alerts directly from the Alerts Manager.
The Alerts Manager is accessed from the Alerts menu.
Actions & Properties
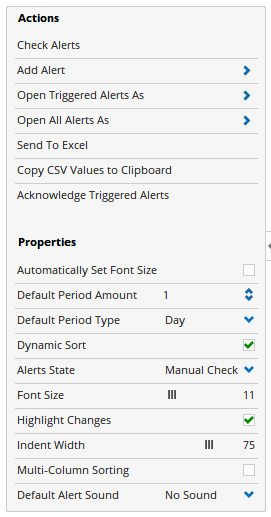
Actions
Check Alerts: If the Alerts State property has been set to Manual Check, clicking this action will check the alerts with the latest available data to see if they have been triggered.
Add Alert: Allows you to add a new Time / Price or Technical Alert.
Open Triggered Alerts As: Allows you to open all triggered alerts as Charts / Watchlists or any other multi-code styled chart.
Open All Alerts As: Allows you to open all symbols with an alert set as Charts / Watchlists or any other multi-code styled chart.
Send to Excel: If you have the Publishing Module you can send your Alerts list directly to Excel as a spreadsheet.
Copy CSV Values to Clipboard: Copies the values from the Alerts list into the clipboard where it can be pasted into Notepad / Excel, etc.
Acknowledge Triggered Alerts: Rather than ticking the acknowledge checkbox for each individual alerts, clicking this action will acknowledge them all at once.
Properties
Automatically Set Font Size: Ticking this checkbox will auto adjust the text font size in the Alerts list so that everything fits into view.
Default Period Amount & Type: Sets the default time frame you want new Alerts to be set up with. 1 Day is the default option.
Dynamic Sort: If using live data, ticking this checkbox will allow the order of the Alert List rows to change automatically as new data comes in.
Alerts State: Allows you to select between Automatic, Startup Only and Manual Check. Automatic will check alerts on a continual basis while Optuma is open. Start Up will check alerts only once after the program has first loaded. Manual check will perform no checks of the Alerts unless the Check Alerts action is clicked by the user.
Font Size: Use this slider bar to increase / decrease the size of the text in the Alerts list.
Highlight Changes: When real-time data is enabled, any changes to Last Price, etc will display with a green or red background which will fade after a few seconds.
Indent Width: Sets the left side indent for text to display within each column.
Multi-Column Sorting: Allows you to set up a sorting of the rows within the Alerts list based on multiple columns.
Default Alert Sound: Allows you to have a sound set by default when creating new alerts (does not affect alerts which have been set up before a default is selected).
Adding Alerts
Adding Alerts from the chart has not changed, the processes are the same as earlier builds, which you can see under Method 1 here.
To add an Alert from the Alerts panel, click on the Alerts menu along the top of the program, in the window that opens click the Add button. A menu will display with the 3 different alert types (Price, Time and T/A).
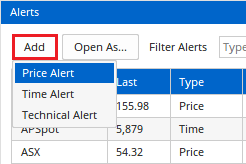
Select the type of alert you want from the menu and the data selector will display.
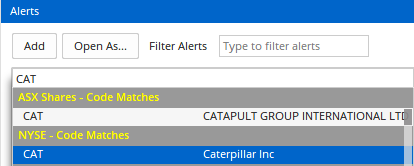
Type in the code you want and it will be added to the Alerts list.
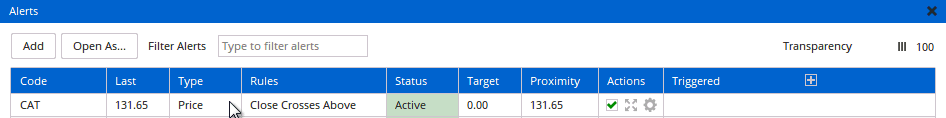
In the case of a Price Alert you can set the Rule (Crosses Above / Below, etc) and the target price:
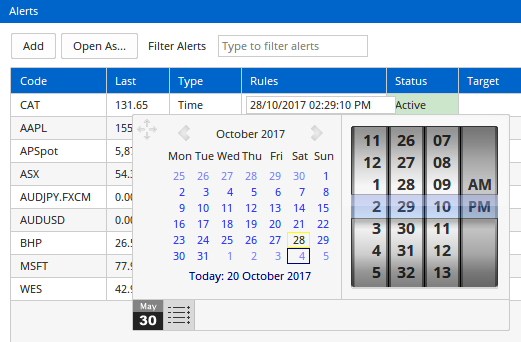
In the case of a Time Alert you can set the Date and Time you want the alert to trigger:
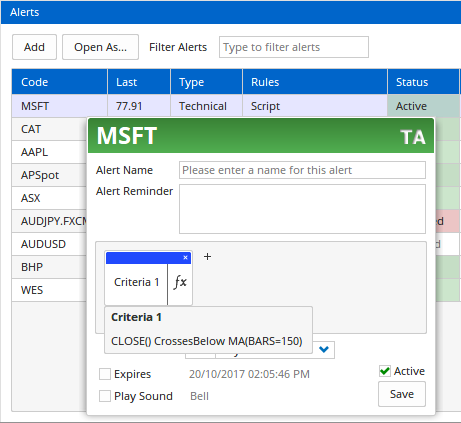
In the case of a T/A alert you can setup the script criteria you want to trigger the alert.
Deleting Alerts
You can delete a single alert from the Alerts window by going to the code and left clicking the small red x on the top right corner of the column.
A Delete icon will display, left click it to confirm the deletion.

To delete multiple alerts at once, hold down the Control key on your keyboard and left click each code to select it. Once all the alerts you want to remove are selected, press the Delete key on your keyboard and select Yes at the confirmation prompt.
Filter Alerts
Along the top of the Alerts window is a filter. You can type a code into this field to reduce the list to easily find the alert you’re after.
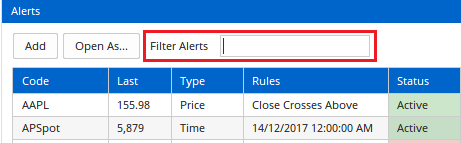
As you type, the list will will become more refined, only displaying codes that match.
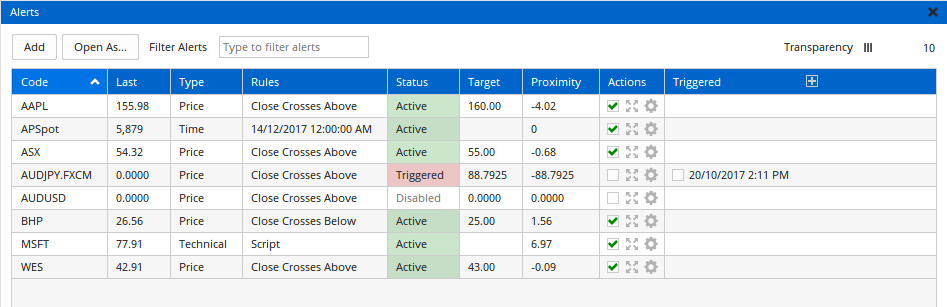
Alert Columns
By default the Alerts panel will contain 9 columns:
- Code: Displays the code the alert relates to.
- Last: The last closing price of the underlying code / data.
- Type: Will display the type of alert set (Price, Time or Technical)
- Rules: This column will display different information based on the Alert type being used.
- Time Alert: A date and time the alert is set to trigger on will be displayed in your local systems date format (dd/mm/yy for example).
- Price Alert: There are 2 parts to the rules of a Price Alert, the first is the part of the bar that will trigger the alert. By default Close is used but it can also be set to Open, High or Low. The second part contains 4 options, Crosses Above, Crosses Below, Equal or Above, Equal or Below.
- Technical Alert: The script (or name of a saved script) will display, clicking it will open the script editor where you can adjust the criteria being used to trigger the alert.
- Status: Will display the status of the Alert (Active (Green), Triggered (Red) or Disabled (Grey)).
- Target: A value will only display in this column if the alert type is Price. This column is used to set the price you want a price alert to trigger at.
- Proximity: If the alert type is Price or Technical, this column will show the range between the current price and the alerts trigger value.
- Actions: The actions column contains 3 icons…
- Enable / Disable: Use this checkbox to turn the Alert on or off.
- Open Chart: Click this icon to open a chart for the underlying code. If the alert was setup using T/A the tools will display on the chart as well.
- Settings: Opens the Alerts settings panel where you can modify options such as whether a sound plays when the alert triggers, etc.
- Triggered: When an alert has been triggered the exact Date and Time stamp will be displayed in this column.
Custom Alert Columns
As with a Watchlist, the Alerts panel supports custom columns being added.
Column Breakdown
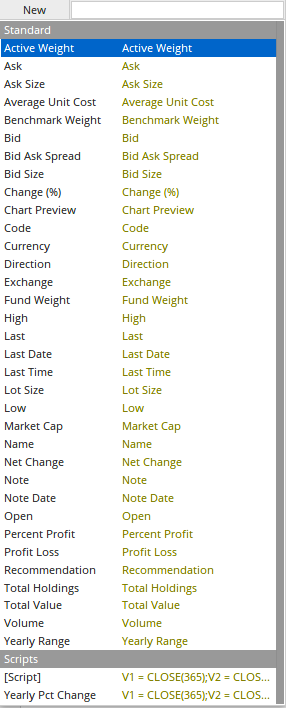
The following columns are available in the Alerts panel:
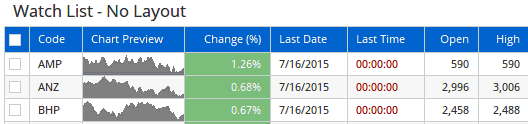
- Change (%) - The Net Change of the security displayed as a percentage rather than a dollar value.
- Chart Preview - Hover your mouse cursor over the Chart Preview column and a small preview of the securities chart will display. Left clicking on the chart preview will open a chart for the selected code.
- Code - The code of the security.
- Currency - This is the currency of the security.
- Direction - The direction of the security is calculated by comparing the latest price to the previous days Close.
- Exchange - Which exchange the security trades on.
- High - The High price for the selected security.
- Last - Displays the Last price the security traded at.
- Last Date - Displays the last date data was added to the security.
- Last Time - Displays the last time data was added to the security. (Real-Time data only)
- Low - The Low price for the selected security.
- Market Cap - The market capitalisation for the security if it is an equity.
- Name - The full name of the security.
- Net Change - The Net Change of the security is calculated by (Latest price - Previous Days Close).
- Open - The Open price for the selected security.
- Volume - The number of units traded for the day.
- Yearly Range - The range that this security has traded over the previous year.
Real-Time data only
- Ask - The cheapest price on the market the selected security can be purchased for.
- Ask Size - The number of units available on the market at the current Ask price.
- Bid - The highest price on the market the selected security has listed, as an unfilled order.
- Bid Ask Spread - The difference between the current Ask price, and the Bid price.
- Bid Size - The number of units wanting to be purchased on the market at the current Buy price.
- Lot Size - The volume of units processed in the last trade.
Journalling Linked data only
Optuma has an integrated Journalling system that is designed to help clients keep notes about their trades. When that system is being used, the following fields are available to add in the Alerts panel.
- Note - This field will display the last Journal added.
- Note Date - The date of the Last Journal entry.
- Recommendation - When using Optuma Journalling, this displays if it has been rated a Buy, Hold or Sell.
Adding a Column
Left-click on the + sign located to the right of the last Alerts column.
In the window that displays, left-click on the column you wish to add.
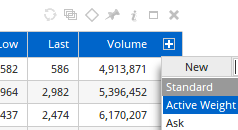
The Alerts panel will update to display the new column.
Removing a Column
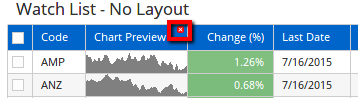
The fastest way to remove a column from the Alerts panel is to go to the column header along the top row of the Alerts. Hover over the column you wish to remove and left-click the small red x displayed.
Moving a Column
To move a column, go to the column header along the top row of the Alerts panel. Hover over the column you wish to move, left-click and hold the mouse button down while moving your cursor to the position where you’d like the column to display. Once you’re in the desired location release the left mouse button and the column will drop into place.
Analysis Columns
For those who wish to track more customised information, Optuma Alerts include Analysis / Script Columns. An Analysis Column allows for a script to be entered and the result for each security in the Alerts panel will be displayed. If the formula has a true or false result (e.g. is Gann Swing Up?) then that cell in the Alerts panel will be coloured so it is obvious that the condition has been met.
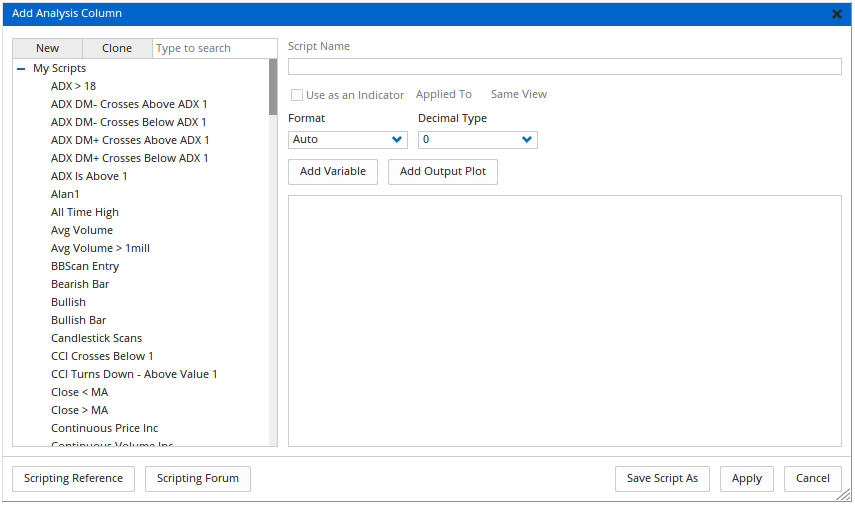
To add an Analysis Column left-click on the + sign located to the right of the last Alerts panel column.
In the window that displays, left-click on New then select Script Column.
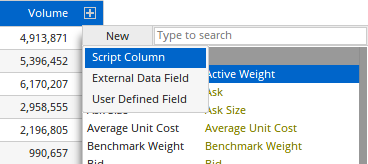
The Add Analysis Column window will display.
In this window enter a header for the Column (“Trigger 1” for example). Then enter the formula you wish the column to display, or calculate from. For more information on the Optuma formula language, please click here.
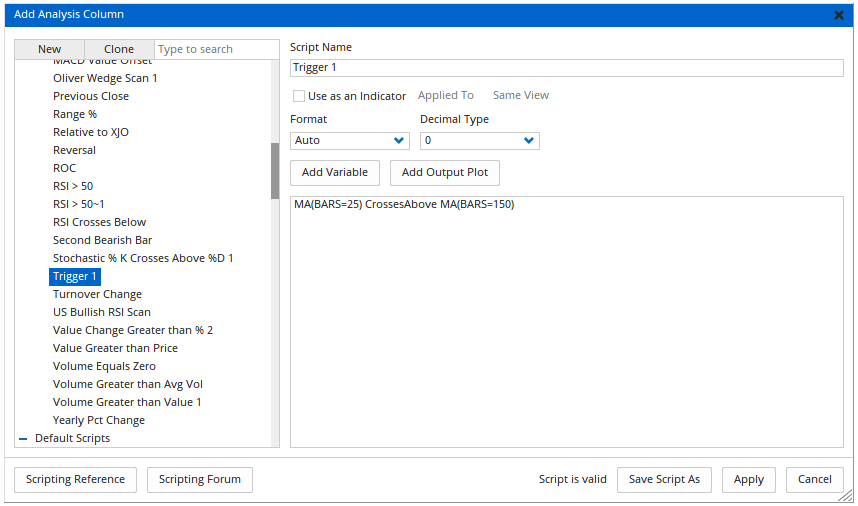
Once an Analysis column has been added, it will either display the indicators current value, or a True / False label.
