Price Units, Factors, and Harmonics for Gann Tools
Overview
To get the most out of the Gann tools and to make them a meaningful part of your analysis it’s important to understand how they work. Many of the tools, such as Gann Fan Angles, use a property called Price Unit in their calculation. The Gann Square Top/Bottom tool also uses time and price factors, whilst the Gann Square Range uses time and price harmonics. This article will explain the difference between them and how each can be used.
Price Unit
The Price Unit is the foundation of all Gann tools. Whenever we need to relate price and time together, it is easy to define time as it is usually one bar, or one week etc, but to define price we need to set a base Price Unit. Typically the price unit is set to the smallest tick movement of a security, but depending on the particular chart’s value and time frame (i.e. 5 minute bars, weekly, etc) in Optuma we allow you to change that so that you can experiment with different price units and see what effect that has on the analysis. Gann often talked about each market having its own “periodic weight” like atoms, the Price Unit is the way that you can experiment with different values.
For example, a security trading at $100 is different from a currency pair trading below a dollar, which is in turn different from an index at 40,000.
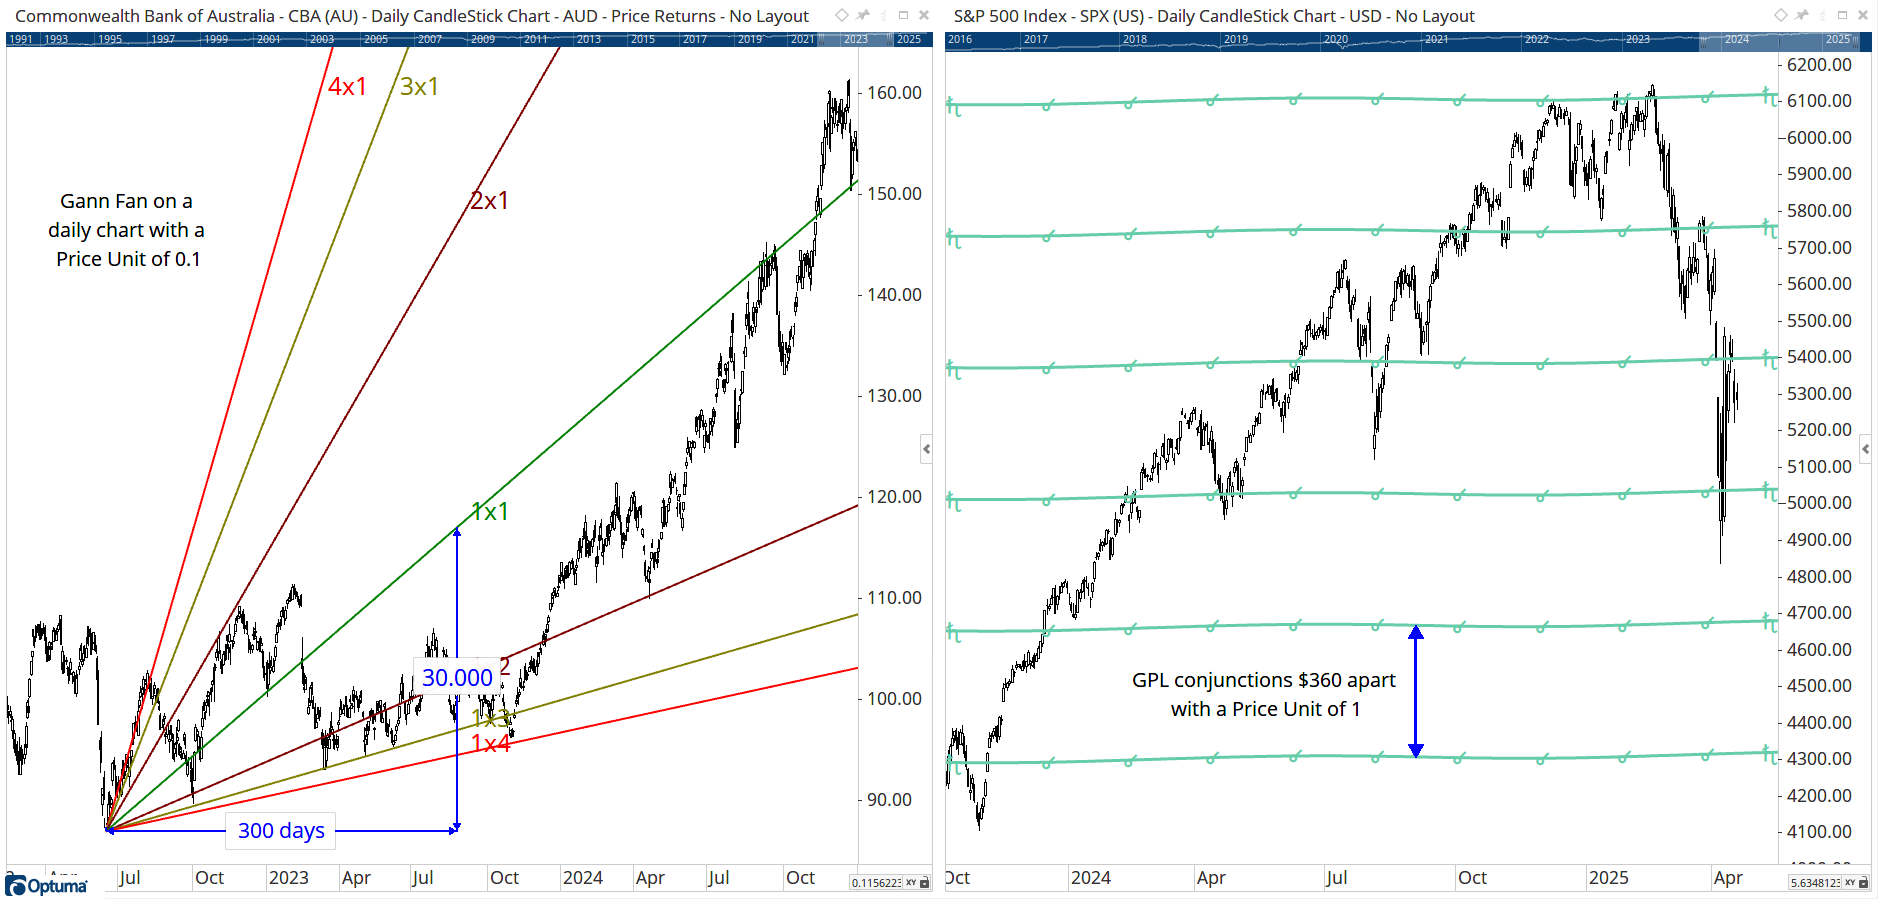
Optuma will try and use the best price unit automatically (eg 0.1 on a stock, 0.001 on a current, and 1 on an index). In this example, the Gann Fann on the daily chart of CBA is set to 0.1 per bar, ie on a daily cahrt the 1x1 line will be $1 higher every 10 trading days. The chart on the right is for the Gann Planetary Lines tool, which draws the conjunctions every $360 apart, as per the example on the S&P500 index. Obviously, this range would be too big for stocks or currencies, so the tool’s Price Unit can be set to 0.1 to divide the range by 10 and plot them $36 apart.
You can also change the price unit to your own value eg 5 points per day or 15.65 points per week, etc. Note that When the Price Unit is the same as the chart’s Time/Price ratio then the 1x1 in the Gann Fan or Gann Square will be a geometric 45 degrees.
Factors
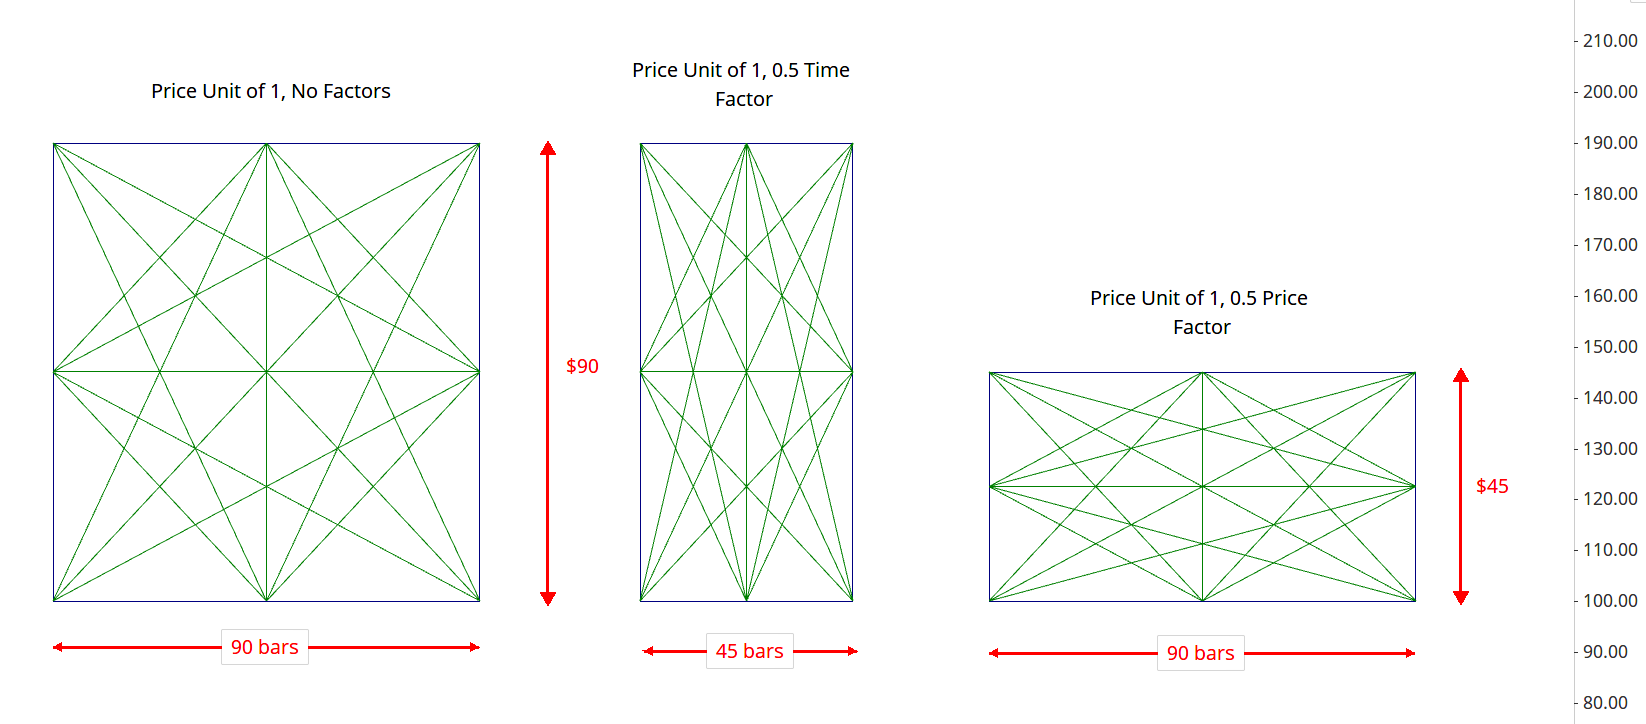
Another way of adjusting the calculations on several Gann tools is by changing the Factor. This scales the interval accordingly, so on a Gann Square set to 90 bars, adjusting the Time Factor to 0.5 will draw the square 45 bars wide. Similarly, if the Price Factor is changed to 0.5 then the box will be $45 high (if the Price Unit is set to 1, or $4.50 if set to 0.1).
The Factor in the Dynamic Square of 9 tool multiplies the difference between the levels. For example, starting at 1 with a Price Unit of 1 and a Factor of 1 the first 360 degree line will be drawn at 9; increasing the Factor to 2 will draw the first 360 degree line at 17. This is calculated by the difference between the lines when the Factor is 1 (i.e. 9 - 1 = 8) and multiplying it by 2 (16) which when added to the start price (1) gives 17. Similarly, using a Factor of 3 will draw the first 360 degree line at 25.
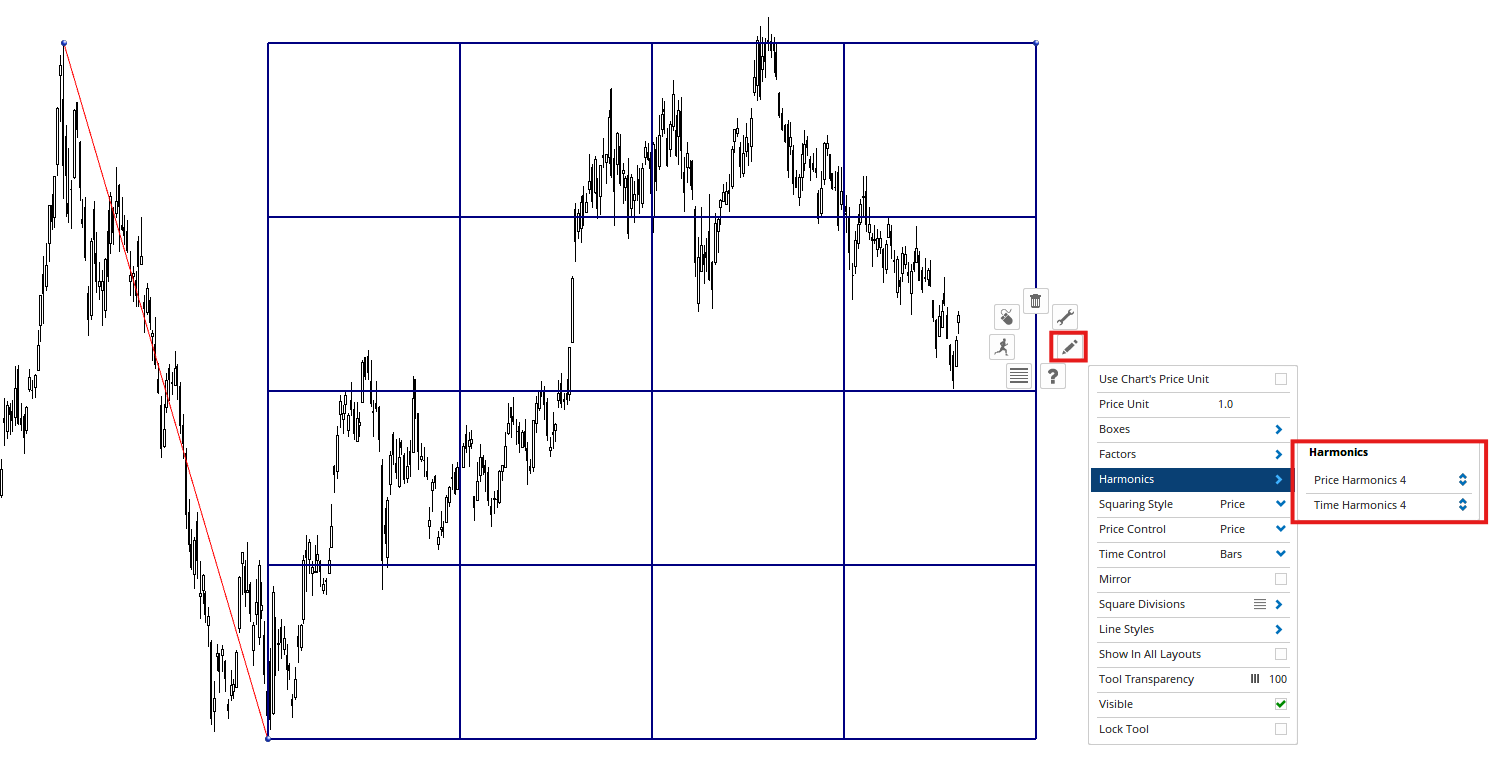
Harmonics
The idea of harmonics originate from wave theory. Where factors scale intervals, harmonics divide them, so when there are two harmonics, the wave - or interval - is split in half, three harmonics splits it in thirds etc. Often in Gann-based tools the harmonics are just as significant.
Harmonics are used to divide the square both in time and price, independently, into smaller more appropriate squares. If a time harmonic setting of 4 is entered, 4 squares are displayed with the same price size as the original square, however the time value is split into quarters based on the original square size for time. If a harmonic of 4 is entered in both price and time, 16 squares are drawn inside the original Gann Square, as in this example: