Short Interest Data
Short interest data refers to the number of a security’s total shares that have been sold short by investors. When an investor engages in short selling, they borrow shares of a security that they believe will decrease in value. The investor sells these borrowed shares in the market with the hope of buying them back at a lower price in the future, thus profiting from the price decline.
Note
Only US and ASX Short Interest data is available at this time, and requires a subscription to the Fundamental database.
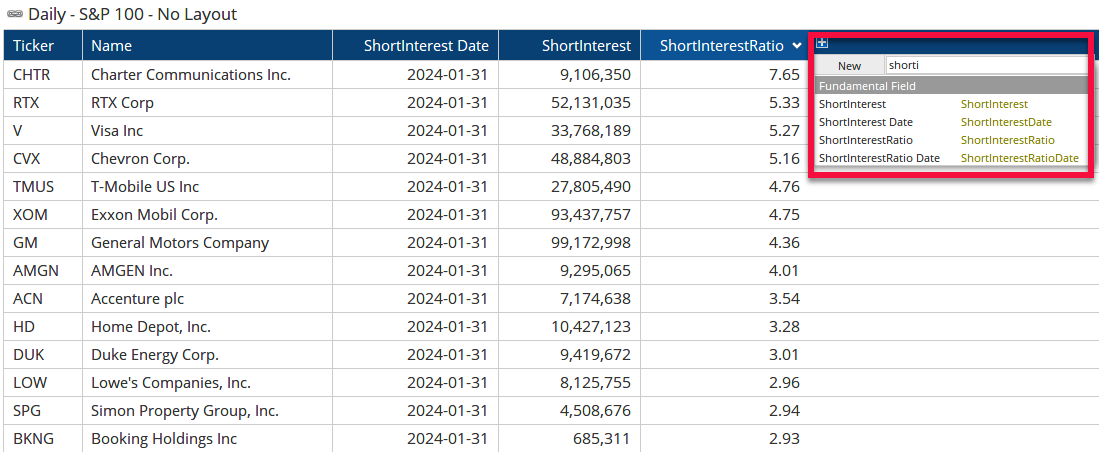
To view the Short Interest data in a Watchlist add the column Short Interest and Short Interest Ratio from under Fundamental Fields (type ‘short’ in the search box to filter the list). The ratio data is also referred to Days to Cover, which is the short interest value divided by the average daily volume . The Short Interest Date shows the date of the last report (the US data is reported twice a month, so could be up to 2 weeks behind).
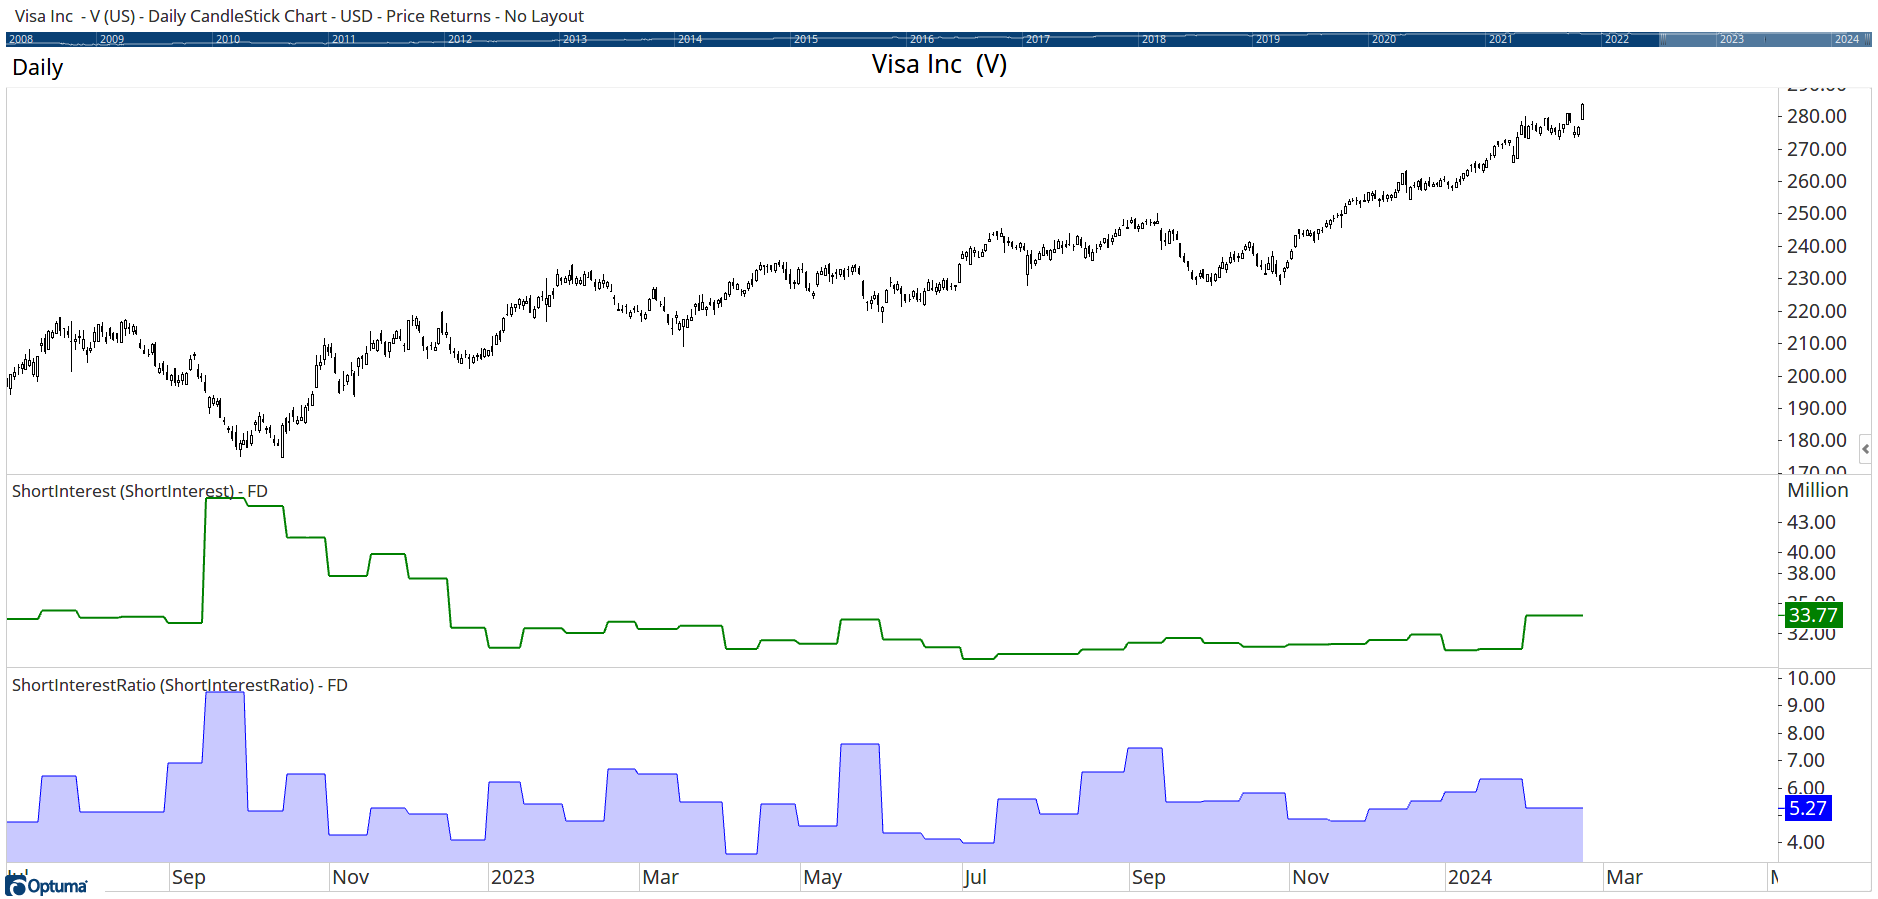
To display on a chart to see the historical values use the Data Field tool. This example of Visa shows that traders have 33 million shares short - the most since May 2023 as the price hits all-time highs. The ratio of 5.27 indicates that it will take over 5 days - based on average trading volume - for these short positions to be covered.