Custom Market Breadth Module
Overview
The custom Market Breadth module has the ability to create a measure based on any technical criteria that can be defined with a script formula. The only requirement is that the script must return either a true/false response (e.g. is the 34 period moving average sloping up?), or a calculation that can be measured (e.g. how far is the close below the ?) Each of these will return result for the selected universe (eg S&P500 companies, or your portfolio) and will show the result as either a percentage, a count, a sum, or an average.
Note
The Market Breadth module is available with a Enterprise Services subscription or as an optional add-on module. Note that standard Breadth data (including Advance-Decline Lines, % above 50MA, % within 20% of 52 week high) are available for major indices as a data selection with your subscription. For more details see here.
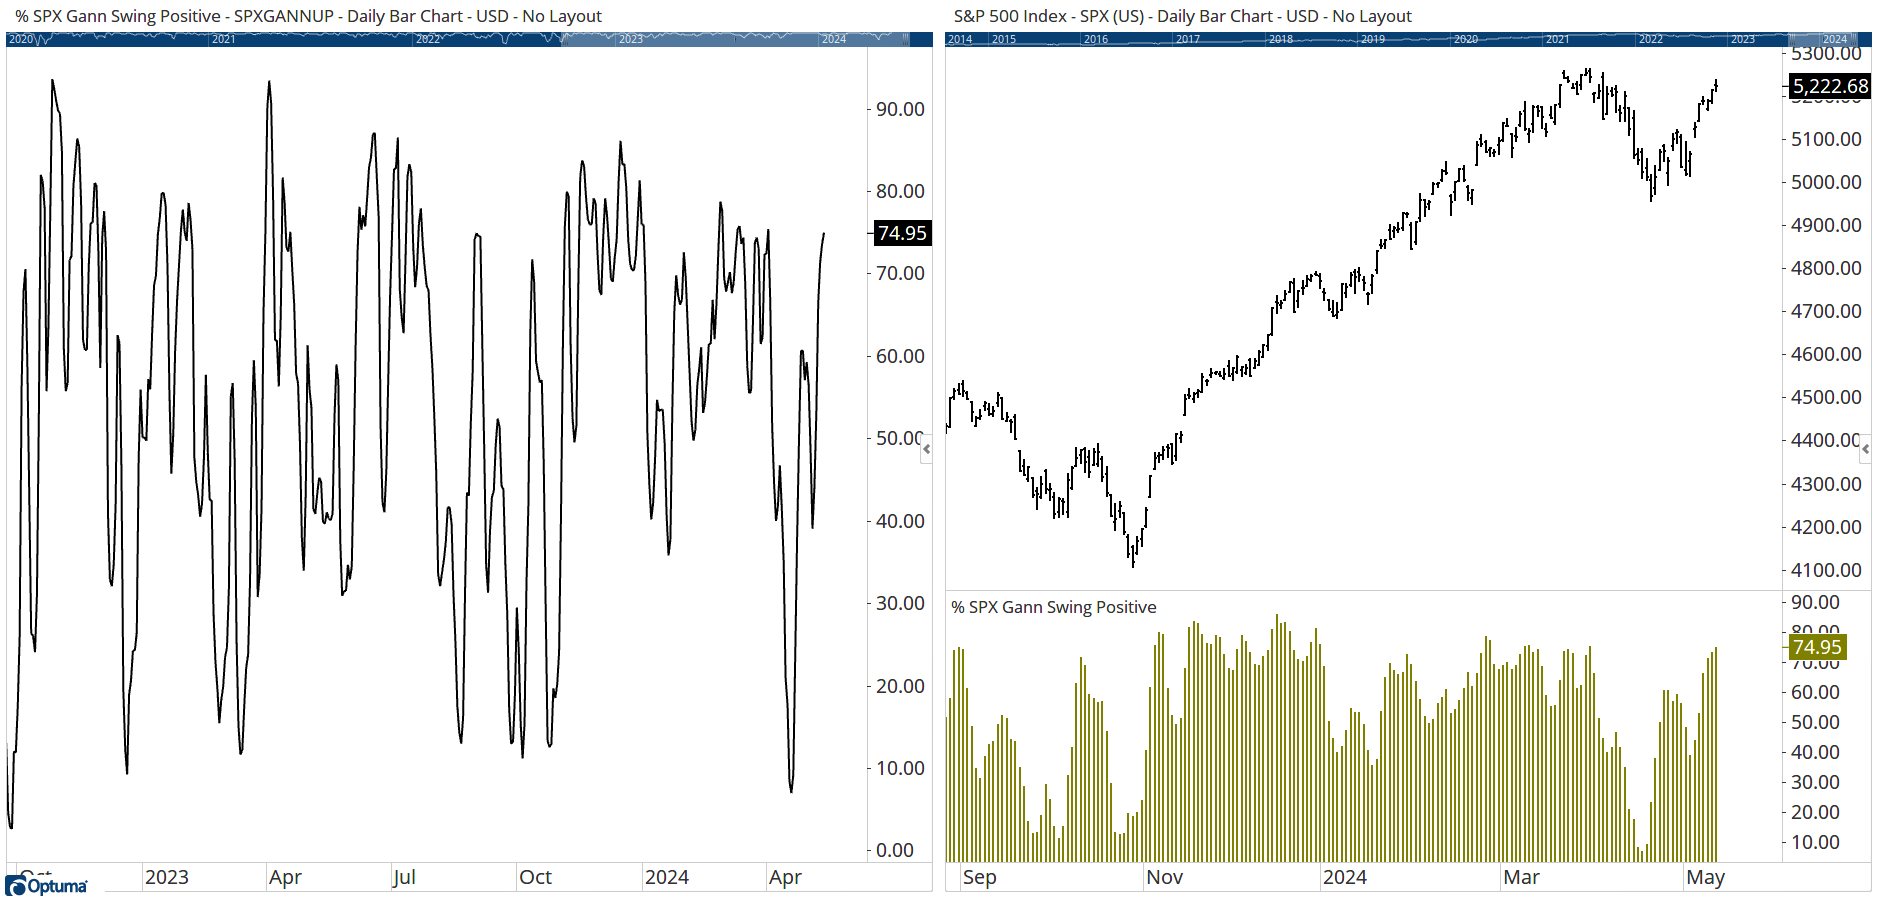
The example below shows the percentage of SPX members with a positive 3 bar Gann Swing. It can be displayed as its own chart as per the example on the left, or below the price chart using the Breadth Data tool.
As well as calculating the percentage of true/false conditions, the Breadth module also has the ability to create the following measures on a universe of stocks (see the Other Settings section below for a description of each):
- Count
- Sum
- Average
- Cumulative
- Spread
- Ratio
- Geometric Average (used to create equal-weighted custom indices)
The following can be used for Advance/Decline studies:
- Advance Decline
- Advance Decline Cumulative Line
- Advance Decline Ratio
- Advance Decline Percent
What is Market Breadth?
The concept of Market Breadth requires an enormous amount of computational power basing calculations on objective data.
The best place to start is with the Advance Decline Oscillator. The value is simply achieved by taking all the members of the Index and comparing the members that are advancing versus the members that are declining. The reason this so important is that it has been found that at market tops, it is the heavyweights of the stock market that are getting the “late money” and due to their size they continue to take the Index higher. What is not so evident is that all the small caps are usually the first to change trend at a turning point in the market. Market Breadth aims to alert the analyst of these changes before it is evident in the trend of the Index.
As an example, in the Dow Jones Industrial 30, if 15 stocks are advancing and 15 stocks are declining our result for that day would be 0 (15-15). Below is a small table with some examples of how the numbers could work:
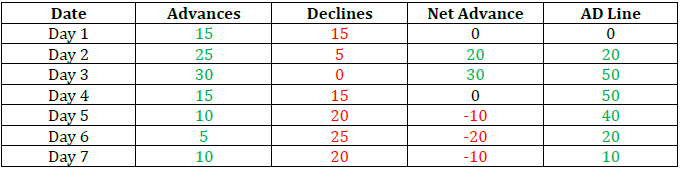
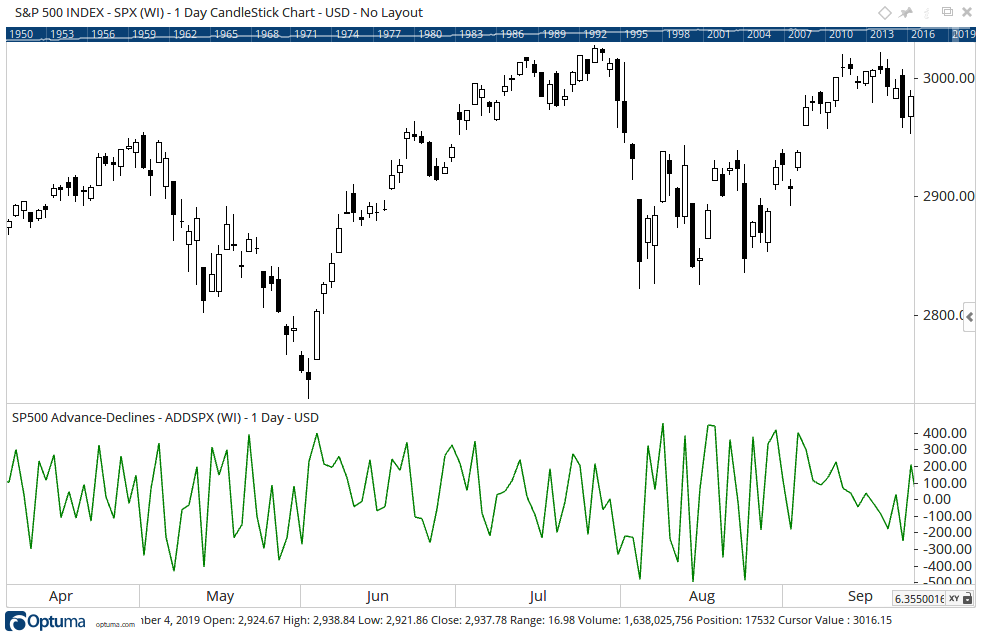
Both the Net Advance and the A/D Line can be used as Breadth indicators. With the Net Advance, the result is more like an oscillator and it gives a chart like the following:
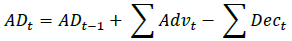
The final column in the table is the A/D Line. This is sometimes more correctly called the Cumulative Advance Decline line where today’s value is based on yesterday’s value and the result of the net advances.
With the A/D Line, the actual value has little reflection to the number of securities as the value can grow to be a very large positive or negative number. Rather, the analyst is looking at the plot and determining if there are divergences between the Index and the AD Line.
How to build a custom breadth measure
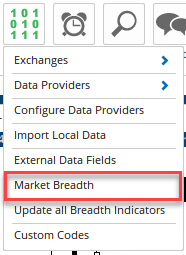
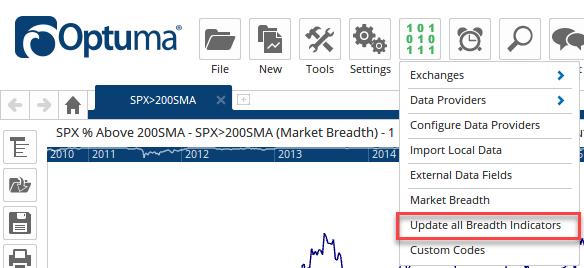
Market Breadth is accessed from the Data Menu in Optuma.
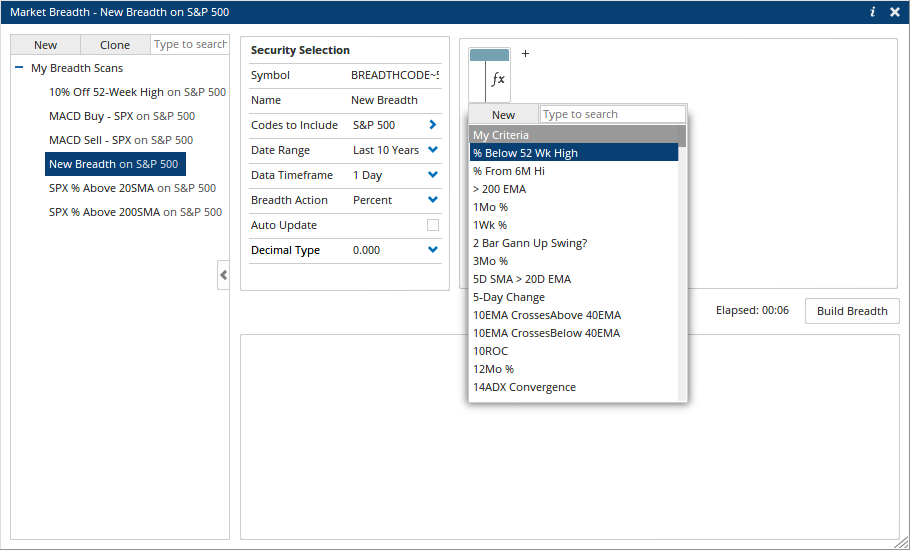
When the Market Breath form opens for the first time, double click on the New Breadth label on the left and give it a name. When creating data you are in effect creating a data series like a standard price chart, so in the Symbol field type a new symbol (please use letters and numbers only) which will be added to your system for use in other areas of the software.
The script editor is ready for setting the criteria used in the breadth, which could be selected from your saved scripts under My Criteria, or click the New button to open the script editor window and create a new formula.
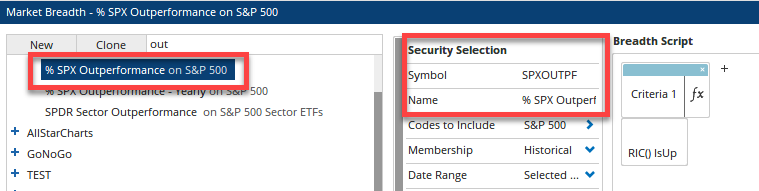
In the script editor, we are going to make our condition to get the percenatge of stocks that have out-perfomred the index for each day. We can do this using the RIC() function (when the RIC is higher than the day before then it has out-performed the index):
RIC() IsUp
Once you have entered the script, select Apply (there’s no need to save or name the script).
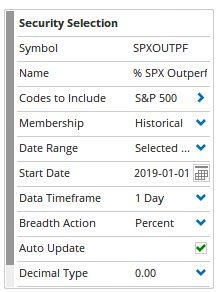
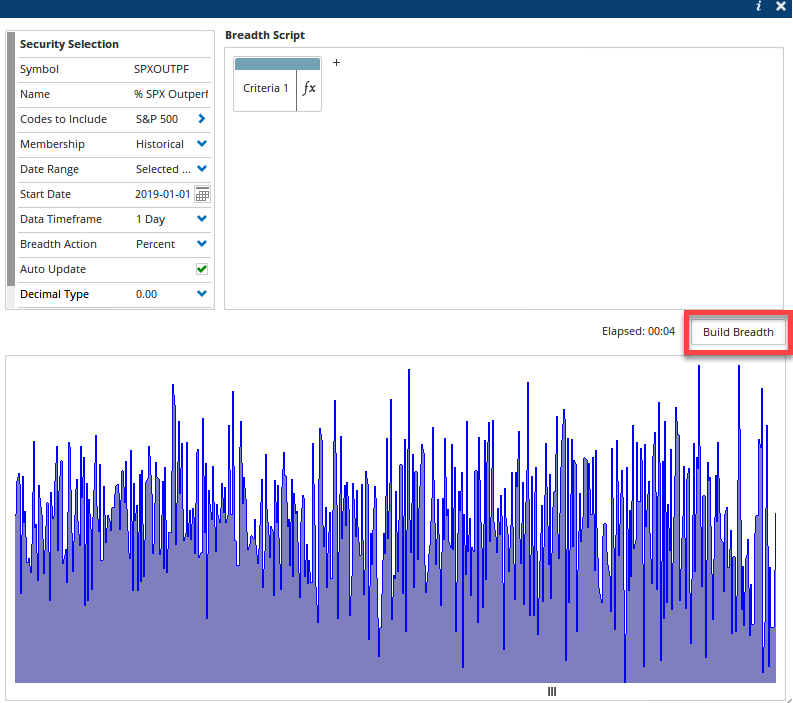
The next step is to give the dataset a symbol and a name in the setup window. The reason for this is that once the calculation is complete, the result is stored in a data file just like any other security. This means that you can overlay it on charts, use in scans, add to watchlists, and even set alerts on it. A good suggestion is to use a combination of the data being used and the condition so that you can easily identify the various measures created. When the name is updated, the Breadth measure in the list is also renamed. This will create a database with the symbol SPXOUTPF:
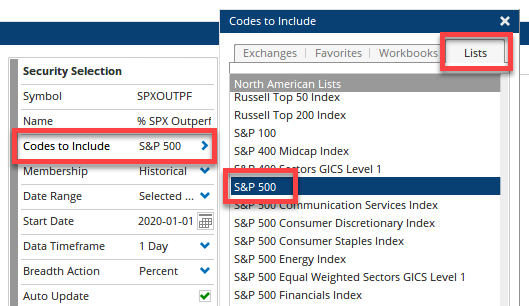
Next, choose the list of symbols that the breadth is being calculated for by clicking on Codes to Include. The options are dependeant on the data source you have, but you can use Optuma Symbol Lists, symbols listed in a CSV file, or the constituents of a Bloomberg Index. In this example, we are going to use the historical members of the S&P 500 Index from Optuma Symbol Lists:
Other Settings
Membership: Allows your breadth to use data that is free of Survivorship Bias. For more information on this, please click here (not available for all Optuma Symbol Lists).
Date Range: This defines how far back you want Optuma to create the calculations. Optuma will load all the data files for that range and then calculate how many passed the criteria. We must put a warning here: if you are using an index without survivorship bias available (eg Russell 2000), then you are selecting the current equities that “survived” ie they are the companies that did not go bust and get removed from the index. Worse from a bias point of view is that some of those equities may have been a penny stock. It’s also good practice to set the Date Range to a selected date so that the start date is consistent, especially if creating a cumulative Advance / Decline line.
Data Time Frame: This allows you to build a breadth code based on Daily / Weekly / Monthly or Yearly data. This can be used when the underlying data building the breadth is only updated in weekly, monthly or quarterly intervals.
Breadth Action: This defines the type of result displayed. The following are the possibilities:
- Percent: What is the percentage of the members that have passed the test? We count the passes and divide by the total number of universe members.
- Count: Simply the number of members that passed the test.
- Sum: This one is a bit of a departure from traditional Breadth. With Sum, you can have a script that returns a value like RSI() or percent that the close is above a moving average and this function will sum together all those values. It is best that your script result is normalised else high-value stocks may overweight the result.
- Average: Based on the Sum above, this one divides the result by the total number of members to get an average each day.
The following take into consideration the members that passed and the members that failed.
- Cumulative: the number that passed the true/false test is added to the result of the previous day. If none passed then the line would be flat.
- Spread: This takes the difference between the number that passed and those that failed. If 125 passed and 375 failed, the result will be -250.
- Ratio: In this case, the number that passed is divided by the number that failed (eg 375 passed and 125 failed would give a ratio of 3).
- Geometric Average: This option is used to calculate an equal-weighted custom index, by taking the product of the numbers generated by the script and raising it to the inverse of the number in the series. See here for a video.
These are the advance/decline calculations that require two formulas: eg CLOSE() IsUp for the Advance Script and CLOSE() IsDown for the Decline Script:
- Advance Decline: subtracts the number of false reults from the true (similar to Spread but ignores those unchanged).
- Advance Decline Cumulative Line: takes the Advance-Decline spread and added to the previous value. If 150 advanced and 250 declined then the line would be 100 lower than yesterday.
-
Advance Decline Ratio: similar to the Ratio calculation but ignores those unchanged.
- Advance Decline Percent: calculates (Advances - Declines) / (Advances + Declines) to give a value between -100/+100.
Auto Update: Selecting this option means that when Optuma is started - or when new data is received by the end of day data feed - Optuma will automatically run the calculations for the latest day and add that value to the file to keep it up to date. NOTE: This can be slow if the calculations are intense or data needs to be sourced from a 3rd party.
The Data menu contains an option called Update All Breadth Indicators. When Auto-Update is unticked, you can use this action to rebuild all of your breadth codes at once, rather than one at a time.
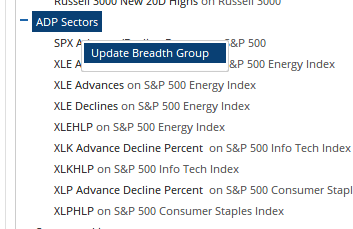
Also, rather than update all your breadth measures at once (which can take a long time if you have a lot of calculations) you can group your calculations and then right-click on the heading and select Update Breadth Group:
Decimal Type: Sets the decimal place setting to be used, e.g. 0.00, 0.0000, halves, 32nds.
Generating the Breadth Chart
Finally, we need to run the Breadth Calculations by pressing the Build Breadth button.
From here you can double-click on the chart below the setup window to open it as a new chart in Optuma, or you can press F3 and type the symbol to select it from the Market Breadth folder.
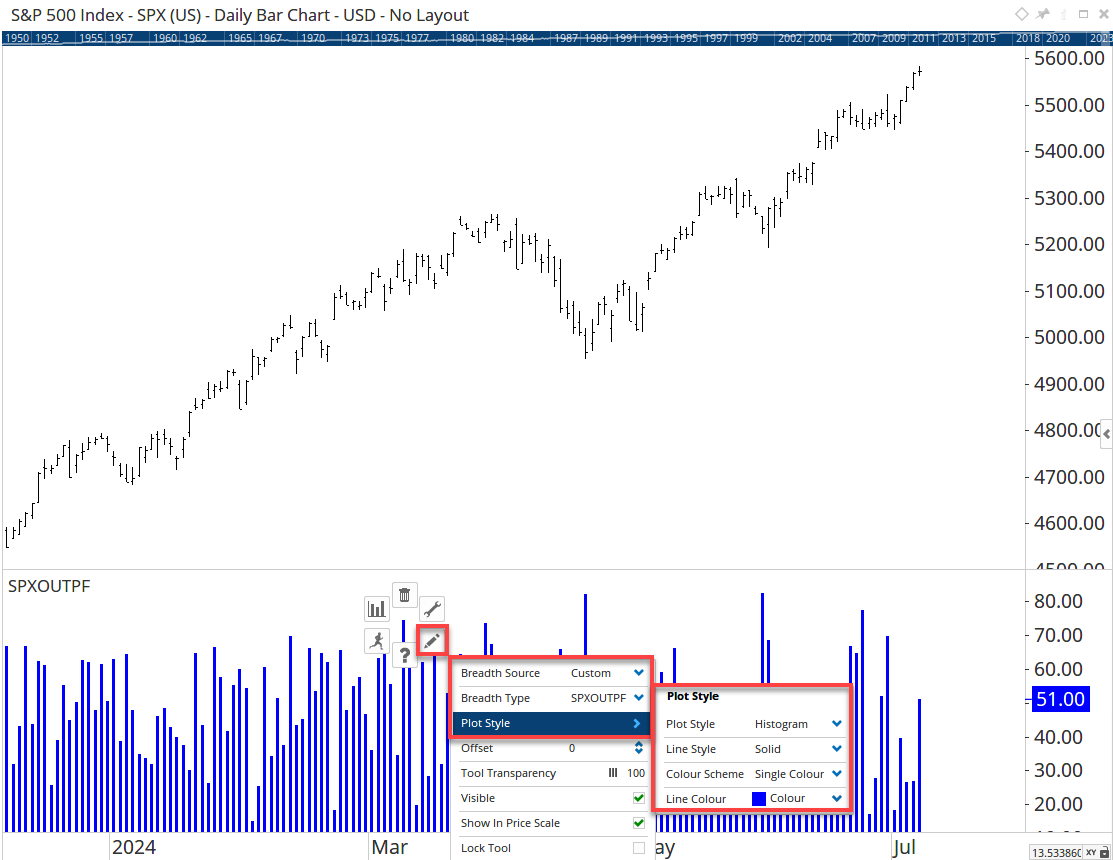
Alternatively, you can add the Breadth Data tool below the price chart, changing the Breadth Source to Custom to select the symbol, and change the Plot Style as required, eg Histogram: