Clients with Australian or US fundamental data enabled on their accounts now have access to short interest data.
What is Short Interest data?
Short selling is a trading strategy used by investors who believe that a particular security’s price will decline in the future. In a short selling transaction, an investor borrows shares of a stock from a broker and sells them on the open market. The investor’s goal is to buy back the shares at a lower price in the future, return them to the lender (the broker), and profit from the price difference.
Exchanges require brokers to report their short positions on a regular basis (every two weeks in the US) which are then published. We can use this data as a sentiment indicator with short interest being the total number of shares sold short that have not been repurchased. When there are too many shorts, there is a risk of a strong covering rally. Due to the high risk involved in shorts and the potential for unlimited losses, short sellers must buy to cover before losses become too great.
The Short Interest Ratio - also called Days to Cover - is an indicator that reveals how long, at current volume levels, it would take for all outstanding shorts to be covered. This is an important indicator as a high ratio can cause panic in short holders, leading to sharp and fast rallies as they seek to cover their positions to protect against inordinate losses.
Adding Data to a Chart
To add the data to a chart use the Data Field tool and select Short Interest and Short Interest Ratio. They can also be added to a watchlist column, by selecting them from the
Fundamental Field section.
Here’s a list of the stocks in the Dow, showing Caterpillar $CAT with the highest Short Interest Ratio of 6.99 as at the last report at the end of February, meaning it will take 7 days
of average volume to cover the 13.9 million shares that are currently short. This has risen from 8 million shares with 2.8 days to cover over the last month as the price has reached all-
time highs (note the data appears stepped on a daily chart as the values are only updated twice a month in the US).
It seems like lots of bears are chasing the $CAT in anticipation of a fall, but if the price keeps rising then the short sellers will start to get nervous and start to buy shares back to cut their
losses, which can quickly push the price even higher. This is known as a short squeeze.
Chart 1 - Dow Jones stocks sorted by Days to Cover ratio
Short Interest as a Percentage of Float
As seen above, Caterpillar has 13.9 million shares sold short, but is that a lot compared to other companies? For example, Apple has 112 million shares short, so how to compare?
By taking the company’s float value (the number of shares available for trading by the public, i.e. not including those held by insiders) we can calculate the percentage of float that has
been sold short.
This requires a simple script formula using the two data fields (because Float is reported in millions and Short Interest is actual value the float value has to be multiplied):
This watchlist of the ASX200 stocks in Australia has been sorted by the percentage of float that has been sold short, with Pilbara Minerals $PLS on top with 23%, suggesting that
sentiment is very bearish.
Chart 2 - ASX200 stocks sorted by percentage of float
Sample Workbooks
If you have the Australian or US Fundamental data enabled on your account you can download sample Short Interest workbooks from the country pages here.
To add the data, click the My Account icon on the welcome screen when you log in to Optuma, go to the Products page and click the Modify Exchanges button.
Darren is the senior Software Specialist at Optuma based in Brisbane, Australia. Darren grew up in the UK and attended college in the USA where he earned a BA in Economics from St Mary’s College of Maryland. He went on to spend a few years working at the Nasdaq Stock Market in Washington DC. Darren joined Optuma in 2009 after attending an introductory technical analysis course that used the software.


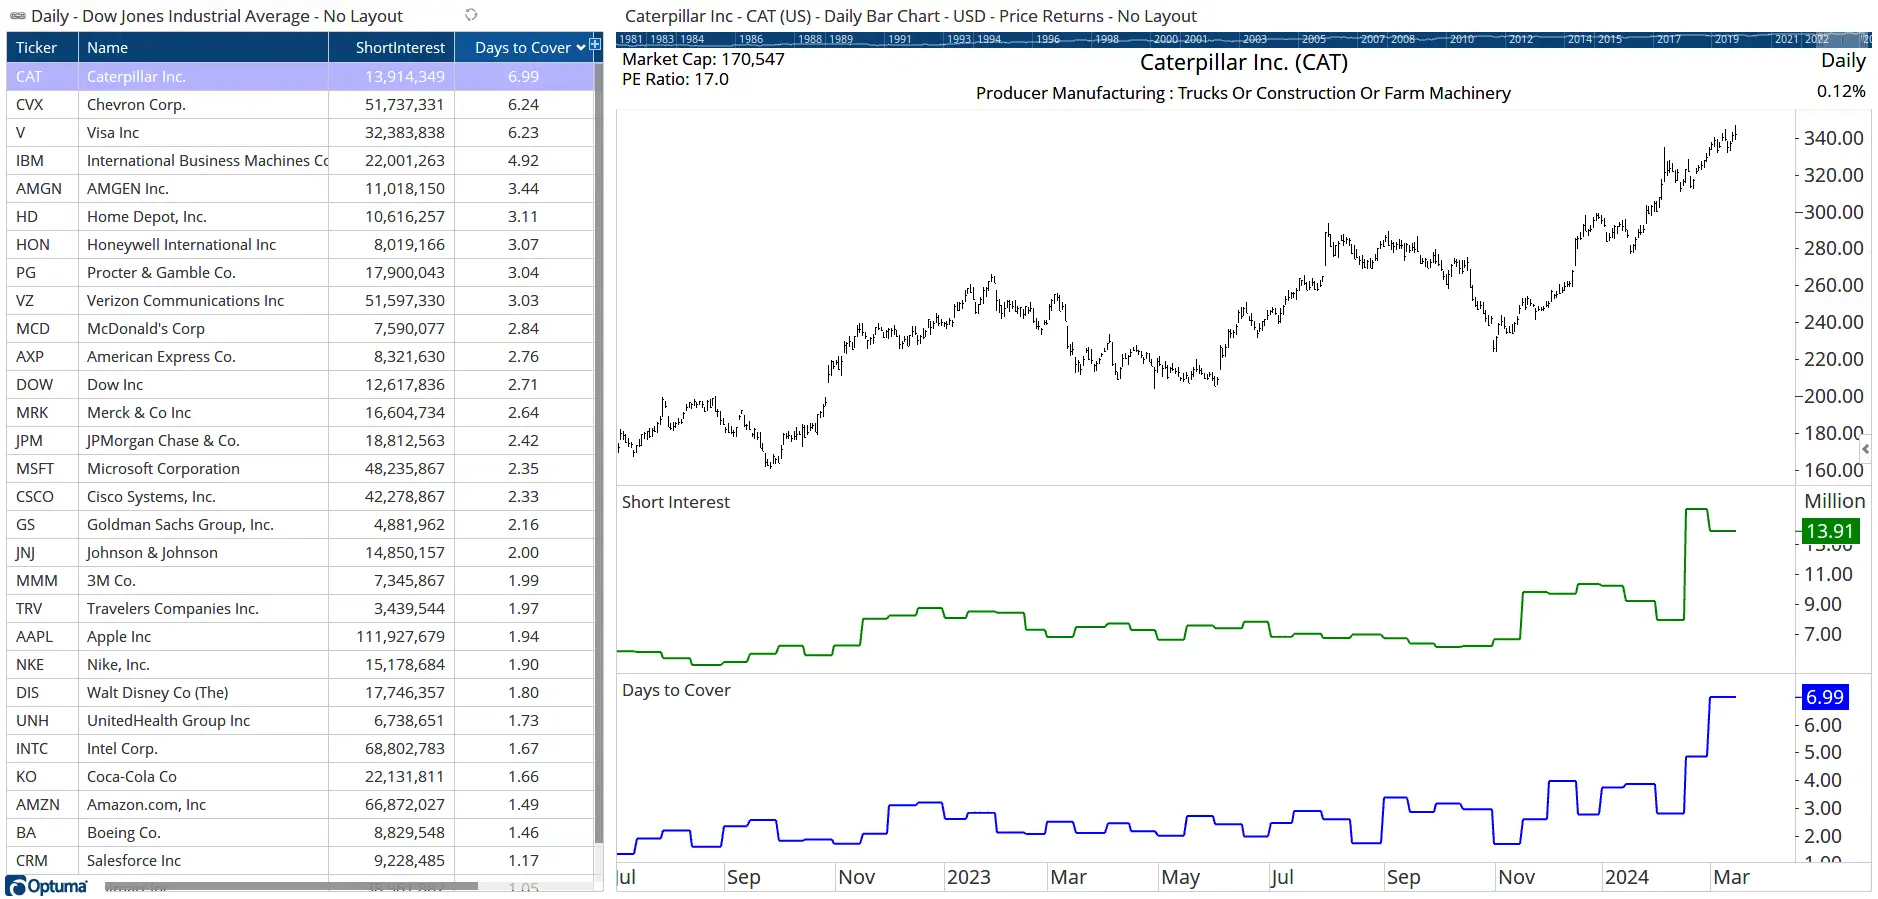 Chart 1 - Dow Jones stocks sorted by Days to Cover ratio
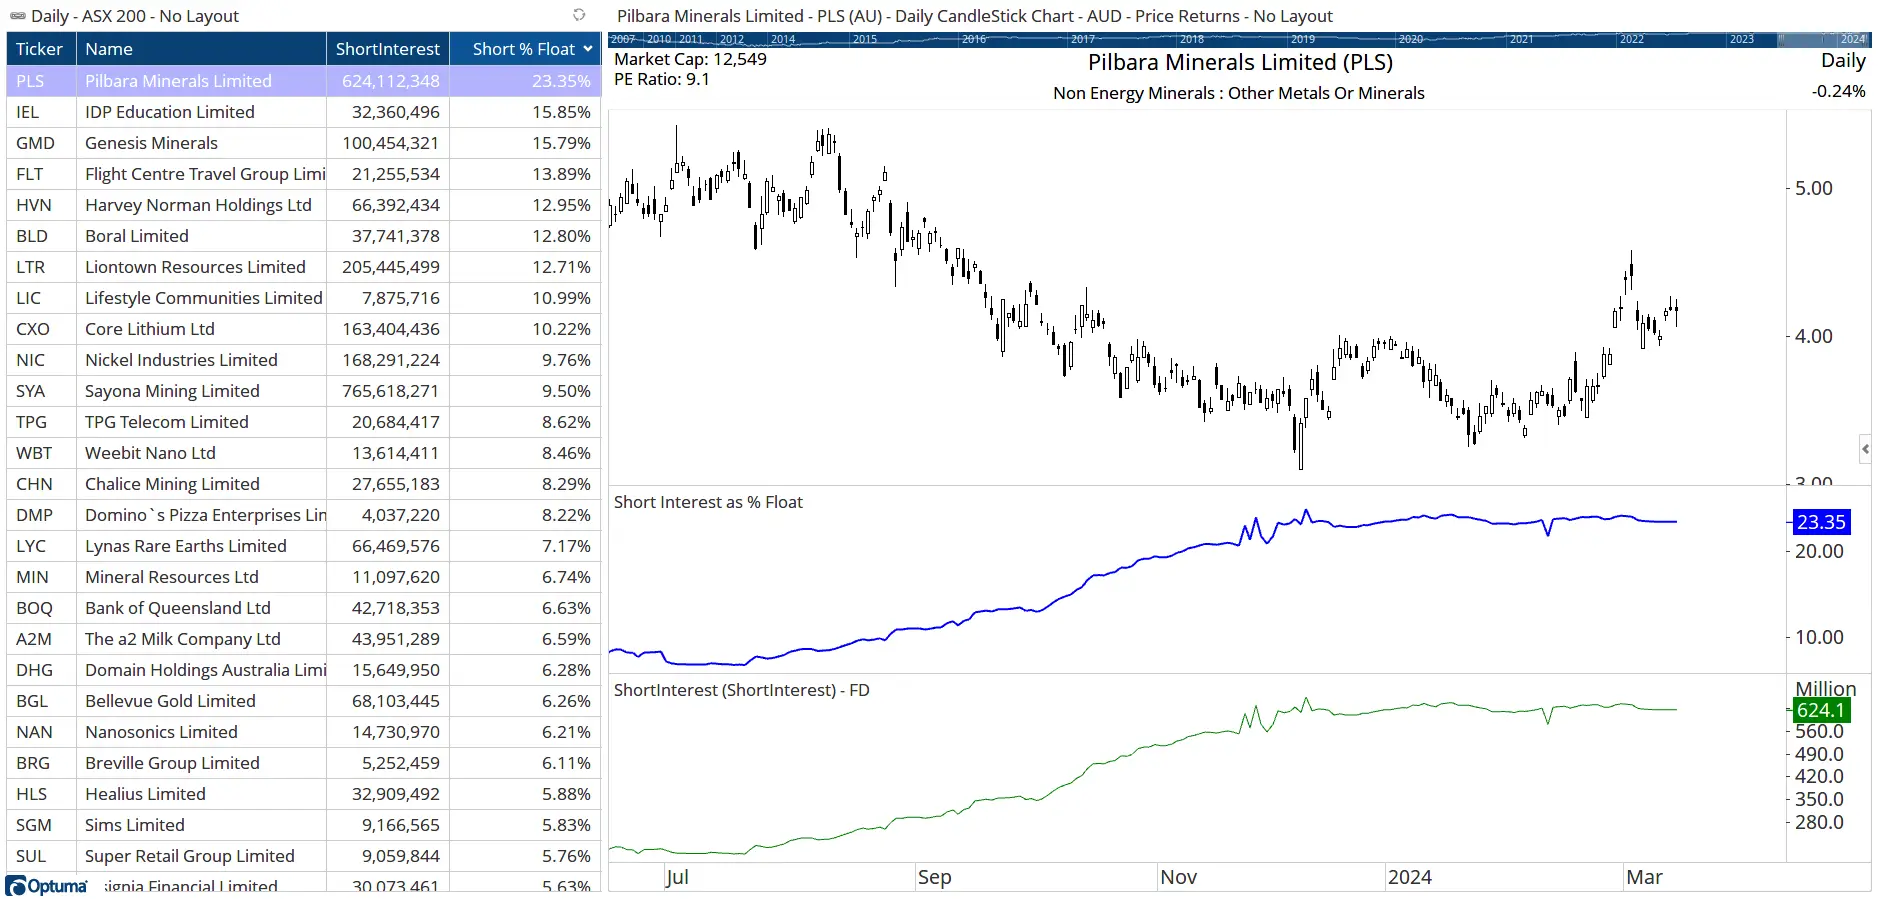 Chart 2 - ASX200 stocks sorted by percentage of float

