Mean Reverting Signals
So far in this series, we’ve been looking at long term general market conditions with an overall bullish sentiment coming through. Today, I want to shift gears and review a mean-reversion technical indicator that we’ve created and look at some short-term signals.
Mean reverting trading is not for the faint hearted. Some liken it to catching a falling knife - you may do it successfully many times but you can also get cut up really badly if you don’t know what you’re doing. They are short-term trading signals, not long-term allocations to a portfolio. Although if the decision has already been made to add a name to your portfolio, a mean-reverting signal is a great entry to ensure the position is profitable from the start.
One way to alleviate the risk is to make sure that we stick to the foundations of Technical Analysis. One of the of the most enduring and important foundations is Dow Theory and two rules that are relevant to mean-reversion trading are:
- Always trade in the direction of the Primary Trend
- Use volume to confirm if a move against the Primary Trend is a temporary correction or a change in the Primary Trend.
The CMT program is a great way to get these core foundations locked in to all you do.
Rule 1 will tell us that we only take the mean reverting signal if we are confident that the Primary Trend is still valid.
Rule 2 tells us that we can look at volume to determine if there is growing support for a change in trend. If volume was growing into a mean-reversion signal, it could be confirming a change in trend and we’d need to be very careful. What we want to see is a general declining of volume into the signal.
Optex Bands
Optex Bands is an indicator that we built to capture high probability mean-reversion trades. (Optex was a shortening of “Optuma Extremes” since we were capturing extreme deviations).
They are built using Market Profile - a concept that has been in use since the 1980s. We have a full explanation of the calculation at https://optuma.com/optex
You can see the Optex Bands in Chart 1. The black line is the “Ratio” line and it is a volatility adjusted measure of how far price is deviating away from the point of balance on the chart.
The dynamic zones are the extreme zones. They are also calculated using Market Profile techniques.
The theory here is that an extreme move in any direction has a high probability of reverting. The more extreme the move, the higher the probability.
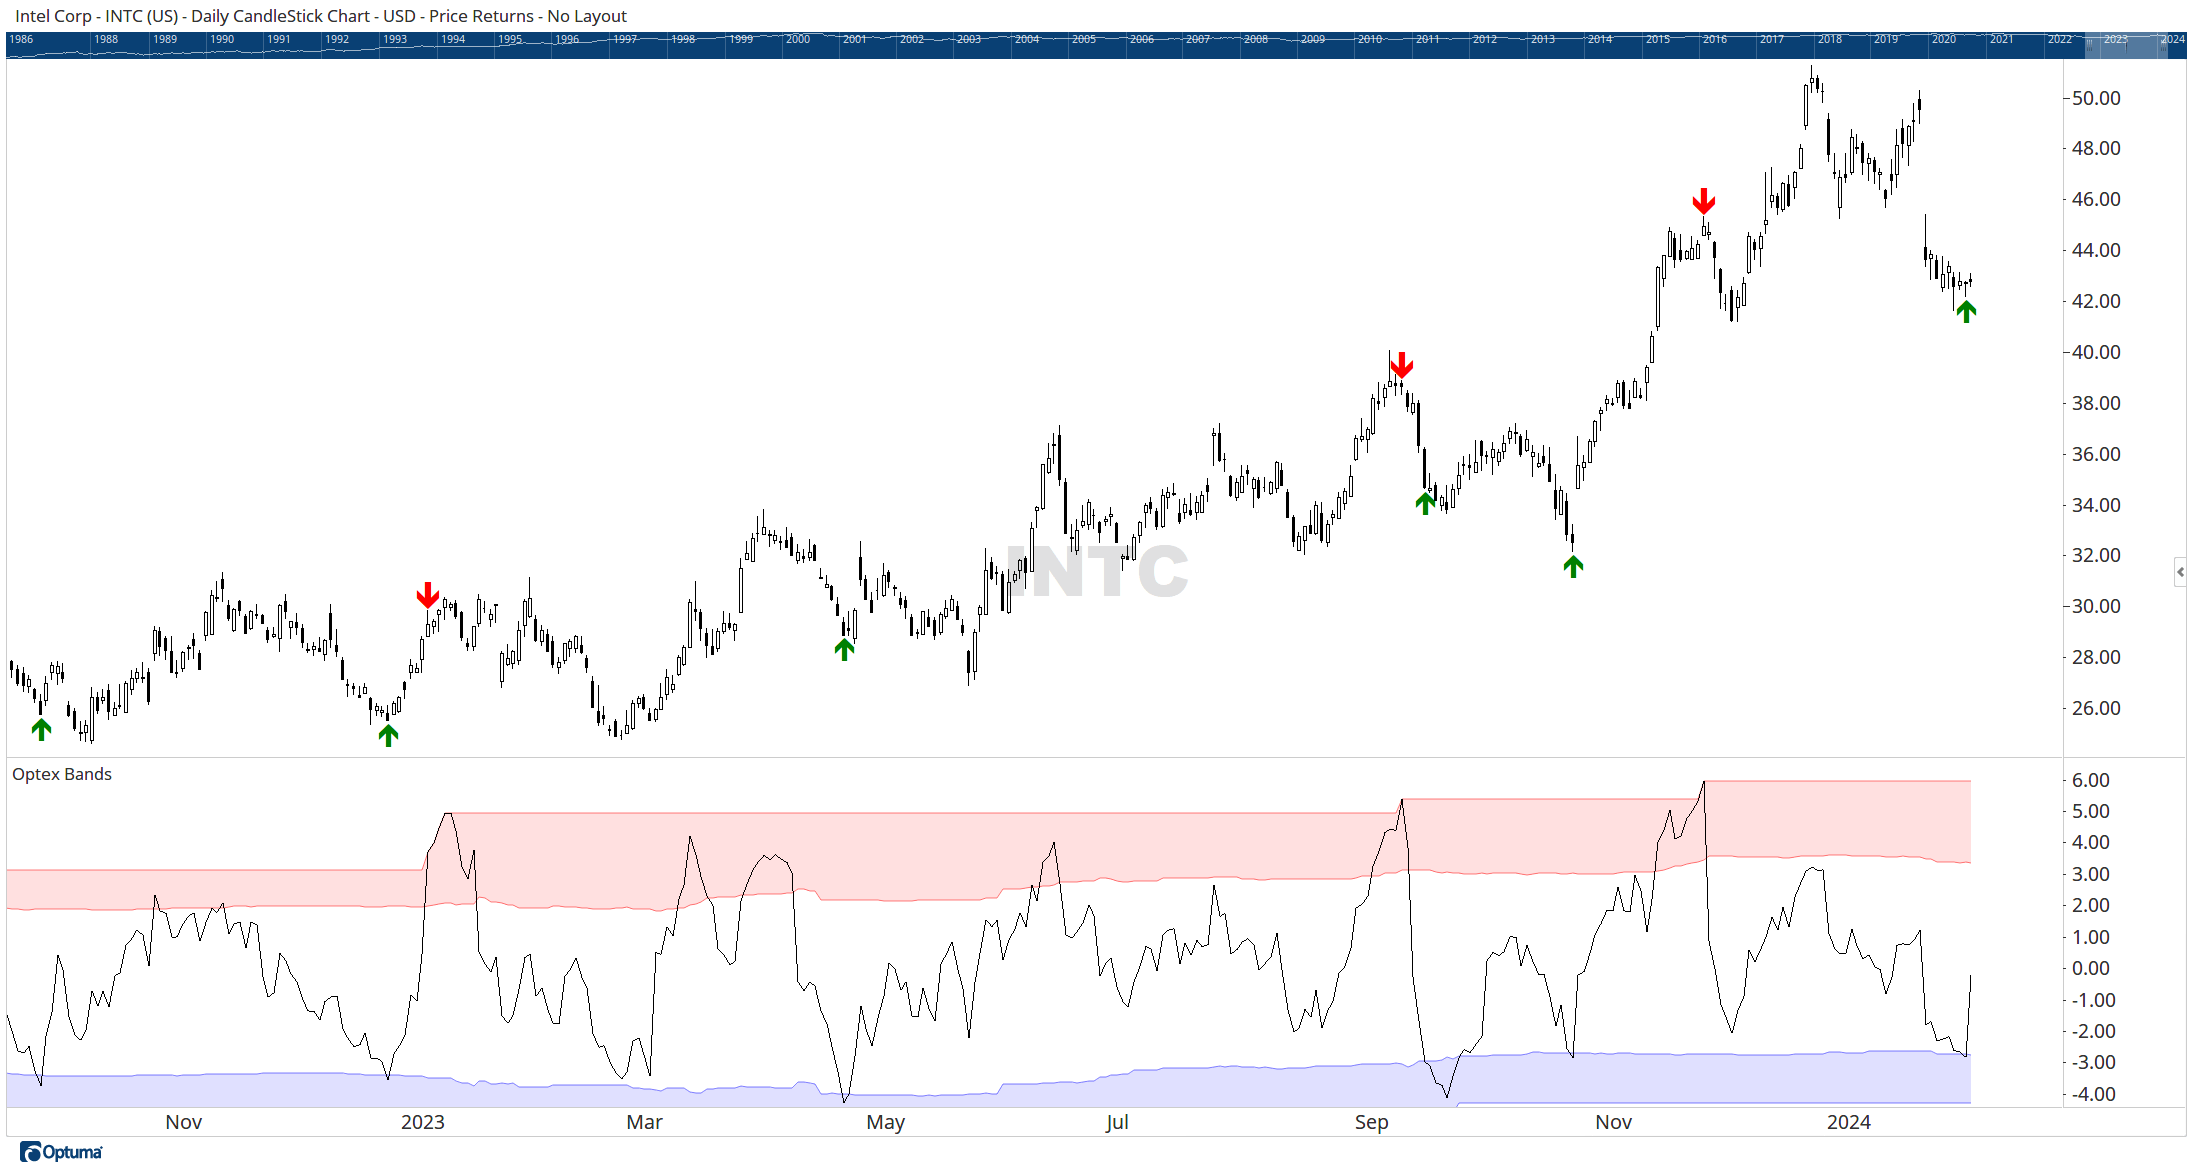 Chart 1: Optex Bands. Courtesy Optuma.com
In Chart 1, I have also added Green Arrows when the Optex Ratio enters the Blue extreme over-sold zone and Red Arrows when the Optex Ratio enters the Red extreme over-bought zone.
They are not perfect signals - no signal ever is - but when coupled with Dow’s rules of “Trade with the Primary Trend” they do yield some good results.
Russell 3000 Optex Signals
While it is great practice to go through charts looking for trading candidates, it’s so much better when we can have the computer do the work for us. In Chart 3 we have scanned for any name in the Russell 3000 that has an Optex Long Signal (as of Feb 21st).
I’ve also included in the Watchlist the monthly change in price (which as you’d expect is down) and the yearly change. I really prefer to see positive yearly numbers as it give me more confidence that the security is in an uptrend giving a higher probability that this will be a good mean-reversion trade. If the monthly is also up (eg Bellring Brands BRBR, and SiriusPoint SPNT) then those really interest me.
Finding the candidates is only step one. We would need to review the chart and make sure that we are confident that we are not breaking Dow’s rules and that we are willing to take on the risk associated with this trade.
Remember! No technical signal is a guarantee of success but as a concept, this type of Mean Reverting signal can be helpful to find trading candidates. Watch these names over the coming days and weeks and see what you think.
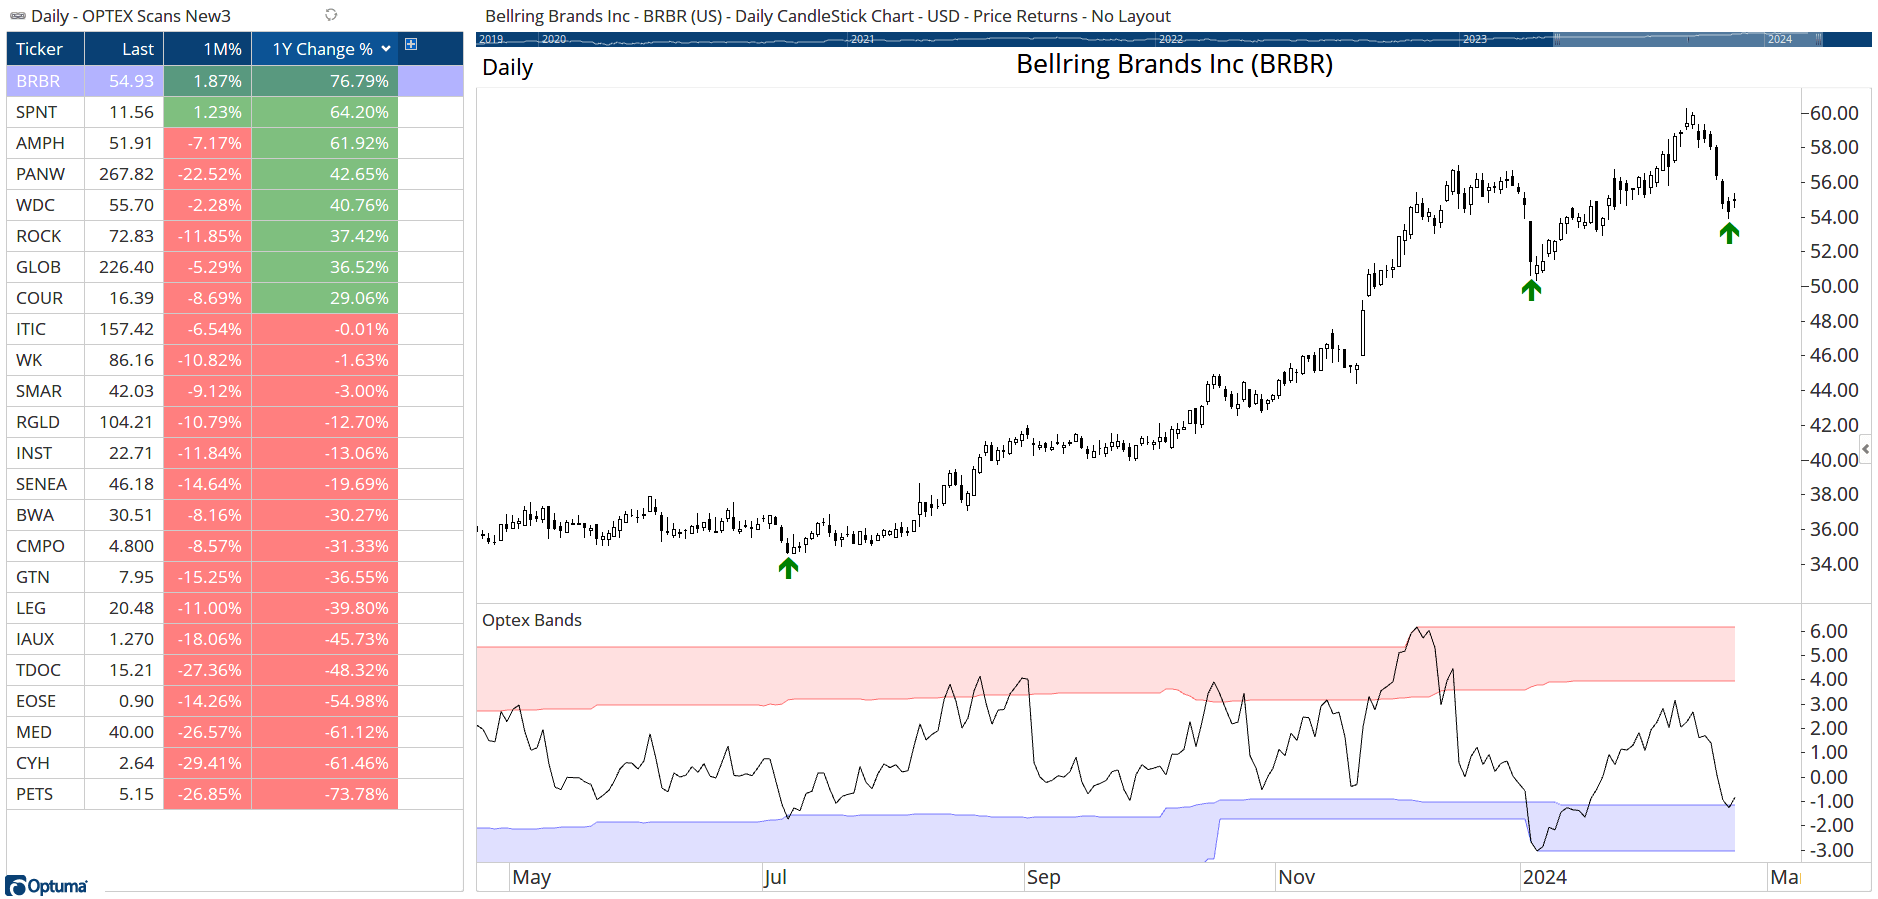 Chart 2: Russell 3000 Optex Signals. Courtesy Optuma.com
RRG Confirmation
Relative Rotation Graphs are a great way to visualise relative strength of a universe of stocks against a benchmark ( you can learn more about RRGs here ).
In Chart 3, I have added these scan results (those names with an Optex Signal) to a daily (on the left) and monthly RRG.
As you would expect, the daily RRG has all these names under-performing the benchmark. The Yearly RRG, however, is highlighting that some of the names are in solid out-performance territory and those are the one that I am most interested in.
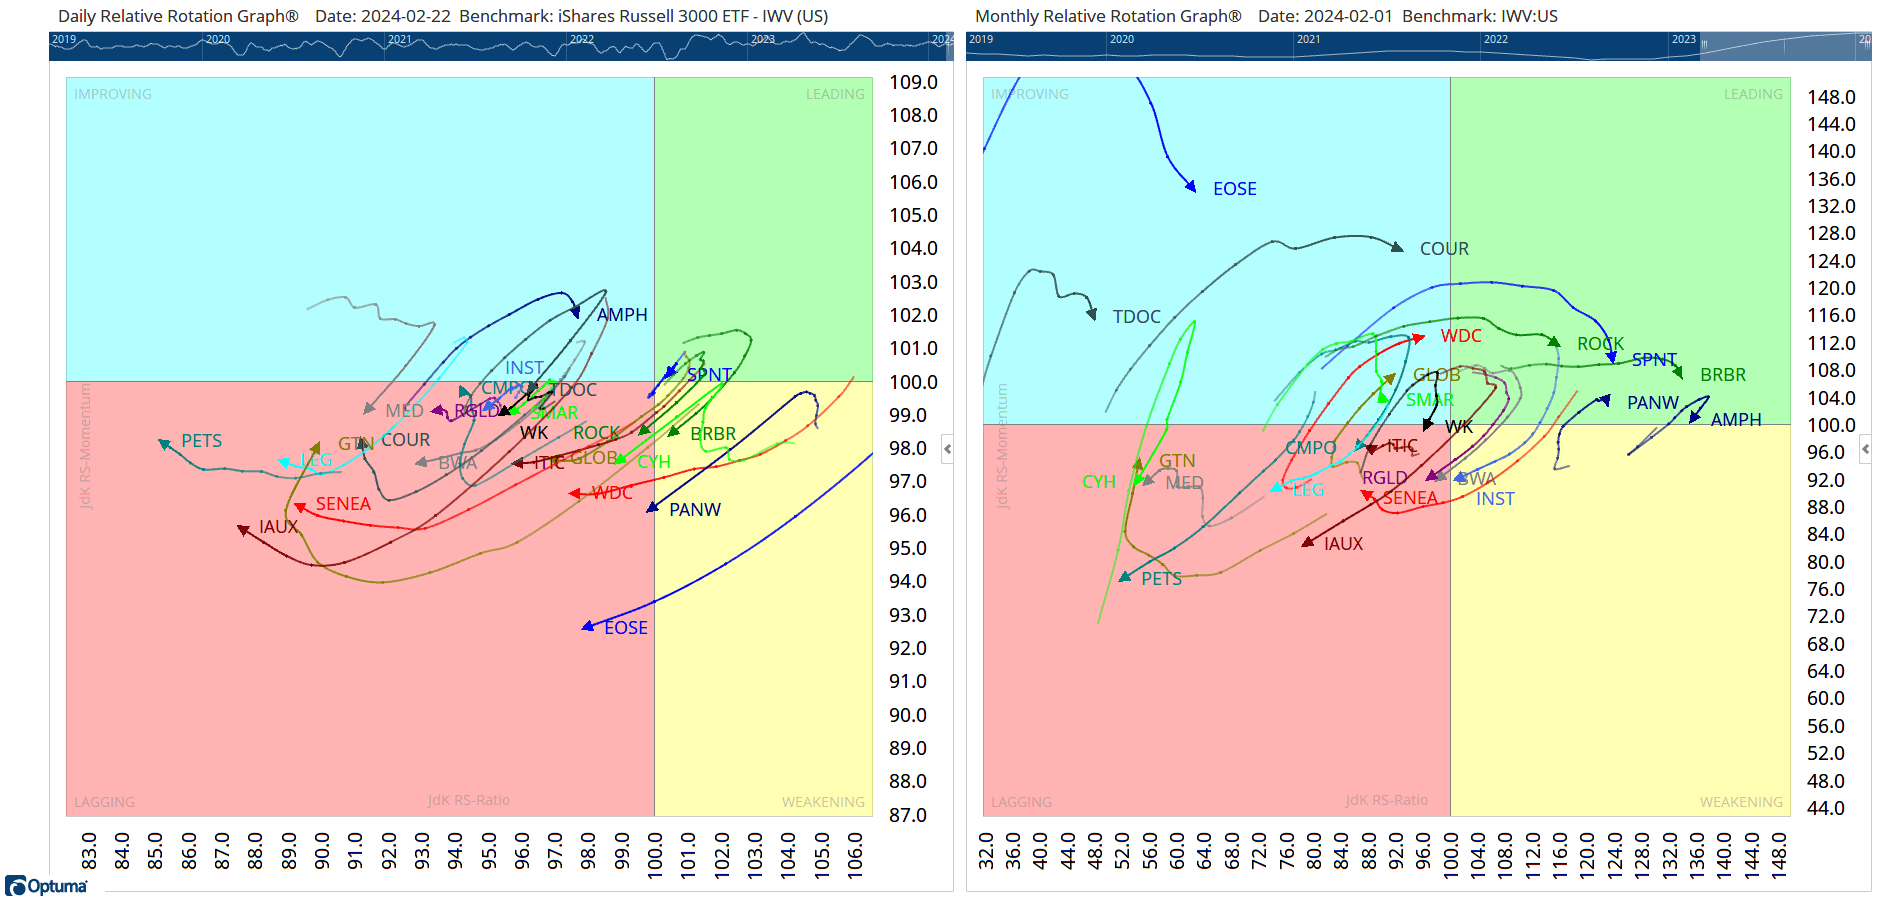 Chart 3: RRG Confirmation. Courtesy Optuma.com


