A lot has been going on in the background here at Optuma in Brisbane. As well as finishing off the Optuma 2.2 update (Beta out now!), we have also been busy with improvements to our data options. As well as improvements to the Sector and Industry classification (you can read about that here), we have also made significant changes to the following Data Products in Optuma:
We’ll dive deeper into the details over the coming weeks, but here’s an overview of what’s available.
Market Breadth
Over many years, we added different breadth measures but there was no consistency when it came to names, symbols, and even location. One of the drivers of the Market Breadth overhaul was to create consistent names and symbols.
The other issue we had was that the power and speed of Optuma itself was not available in our Data Servers. This meant that we had to rewrite everything in a scripting language that was really slow.
With the constant development towards our web-based products, we have now built a web-based version of the Optuma engine and that is what has allowed us to greatly increase the number and complexity of what we can include in the Breadth Measures Data Product.
Following the significant upgrade to our breadth engine, we now have over 50 daily measures for these major global indices:
- Australia: ASX 200, ASX 300, ASX All Ords indices
- US: Dow Jones, Nasdaq 100, Russell 2000, Russell 3000, S&P 400, S&P 500, S&P 600, S&P 1500, - plus Nasdaq & NYSE exchanges (equities only)
- Europe: EuroStoxx 600, FTSE100, FTSE350
- India: NIFTY 500
- Canada: TSX Composite.
The symbology has also been standardised, so that they are consistent across all groups. Here’s a list of the available Russell 3000 measures, which all start with R3K- (S&P500 measures will start with SPX-, ASX 200 ASX2-, etc).
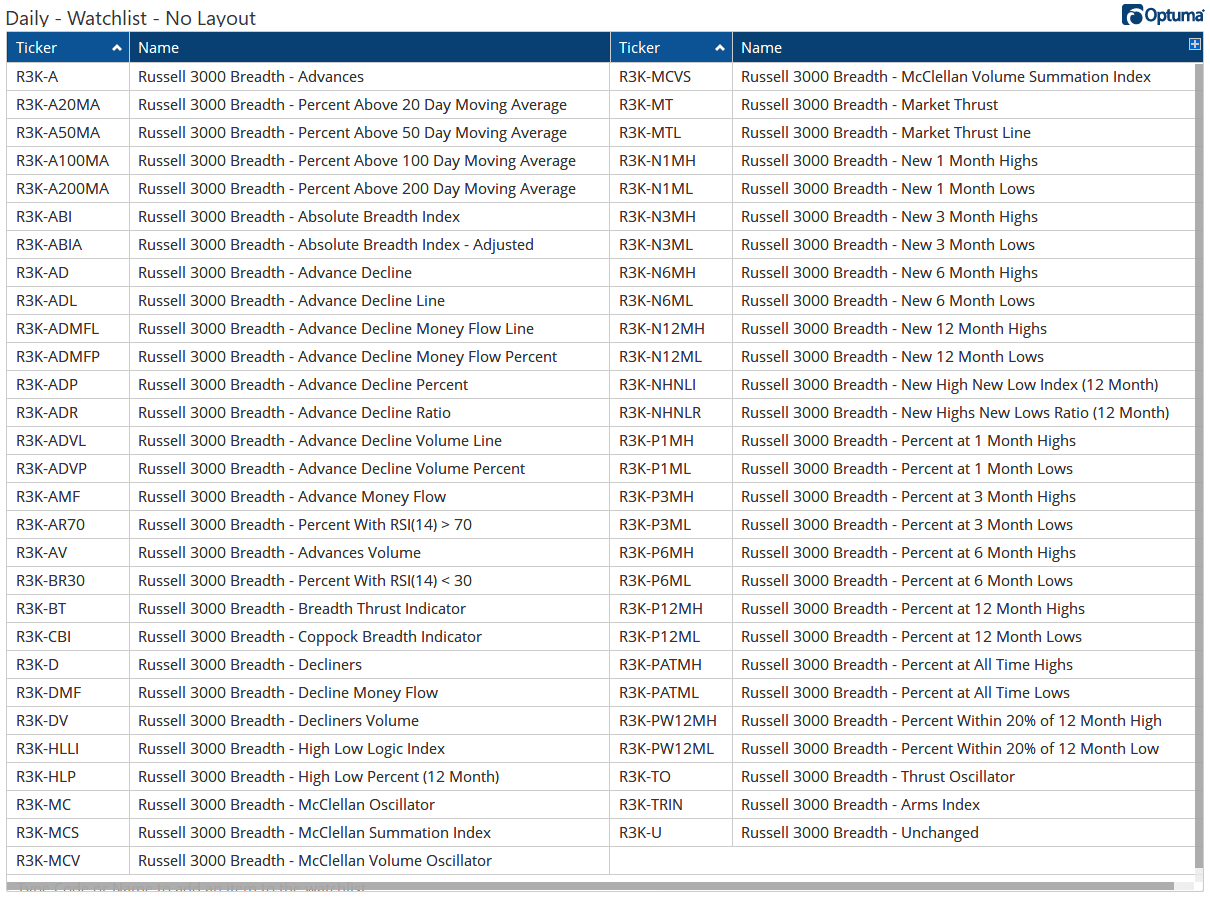 Breadth Data
Economic Data
The new Economic Data - which is not to be confused with the FRED Economic Reserve Data - now has access to over 100 global macroeconomic measures from Australia, Canada, Euro Area, Germany, India, Singapore, Switzerland, UK, and US. This includes historical data for things such as GDP, Unemployment Rate, Inflation, Consumer Confidence, and government bond yields.
For example, here’s a comparison of inflation rates around the world:
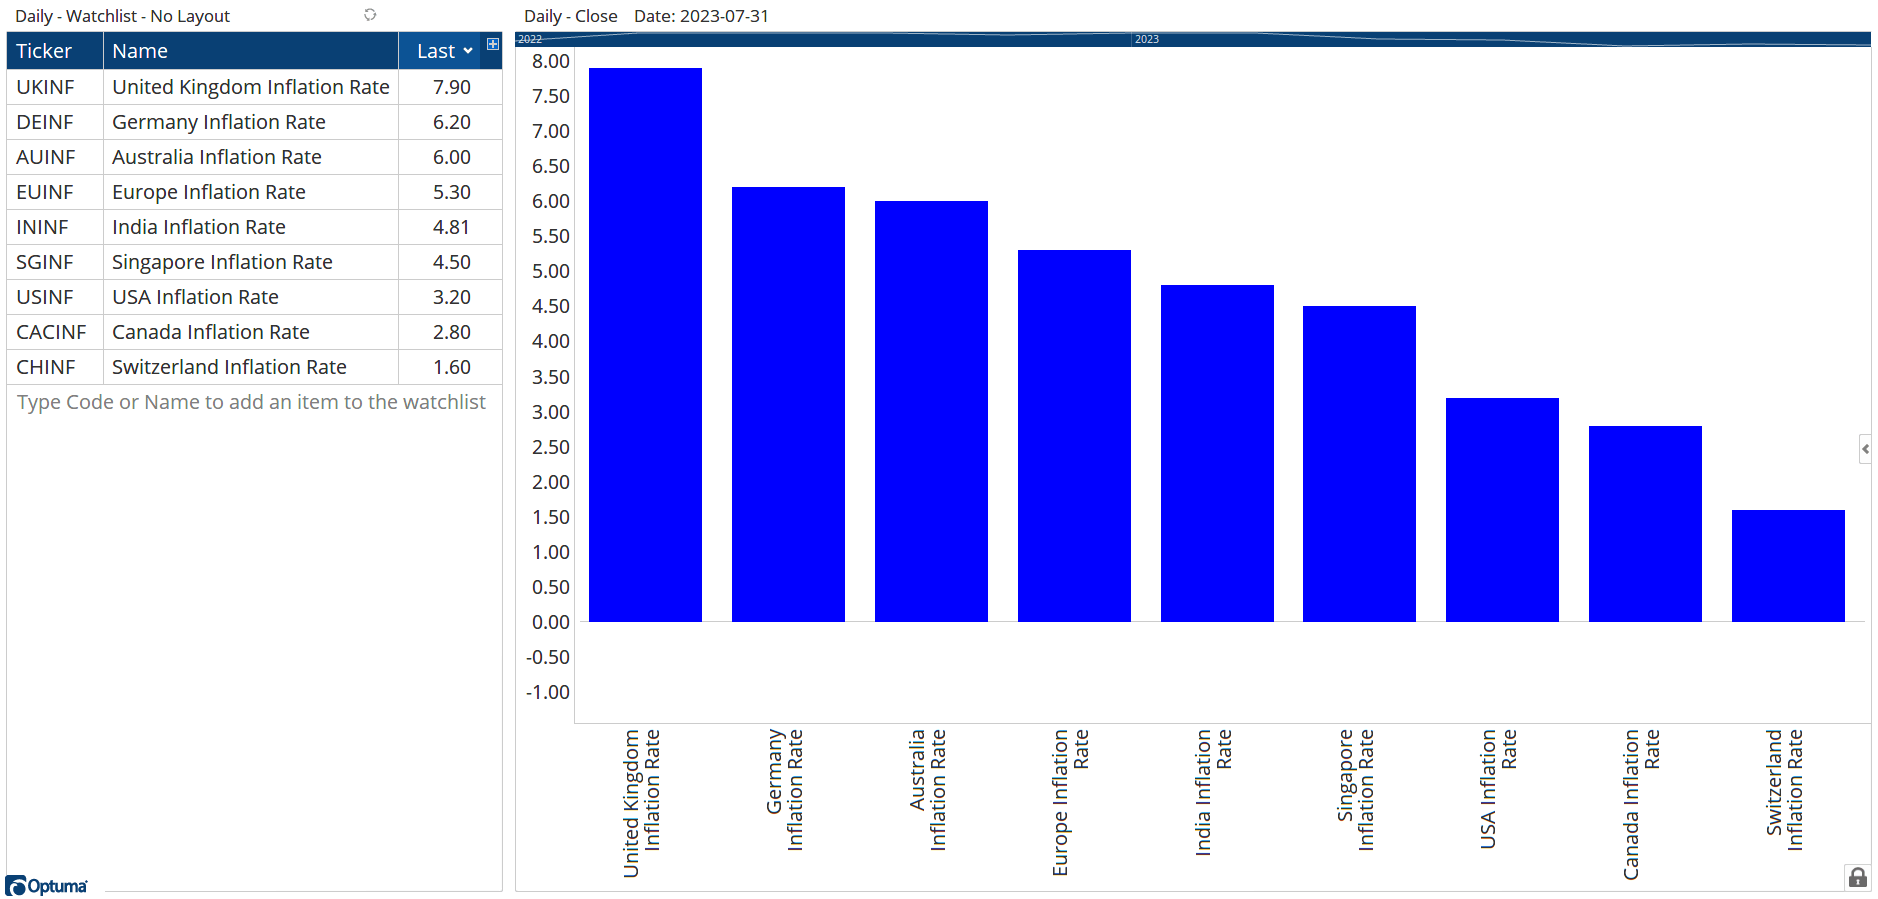 Global Inflation Rates
US Mutual Funds
This new data product replaces our old mutual fund data, with the updated version now including dividends for thousands of US Mutual Funds, as well as the Net Asset Value. To see dividend-adjusted charts click on the Price Returns label in the chart header and change it to Total Returns.
Here’s an example of the Vanguard Total Bond Market Index Fund $VBTLX, with total returns on the right:
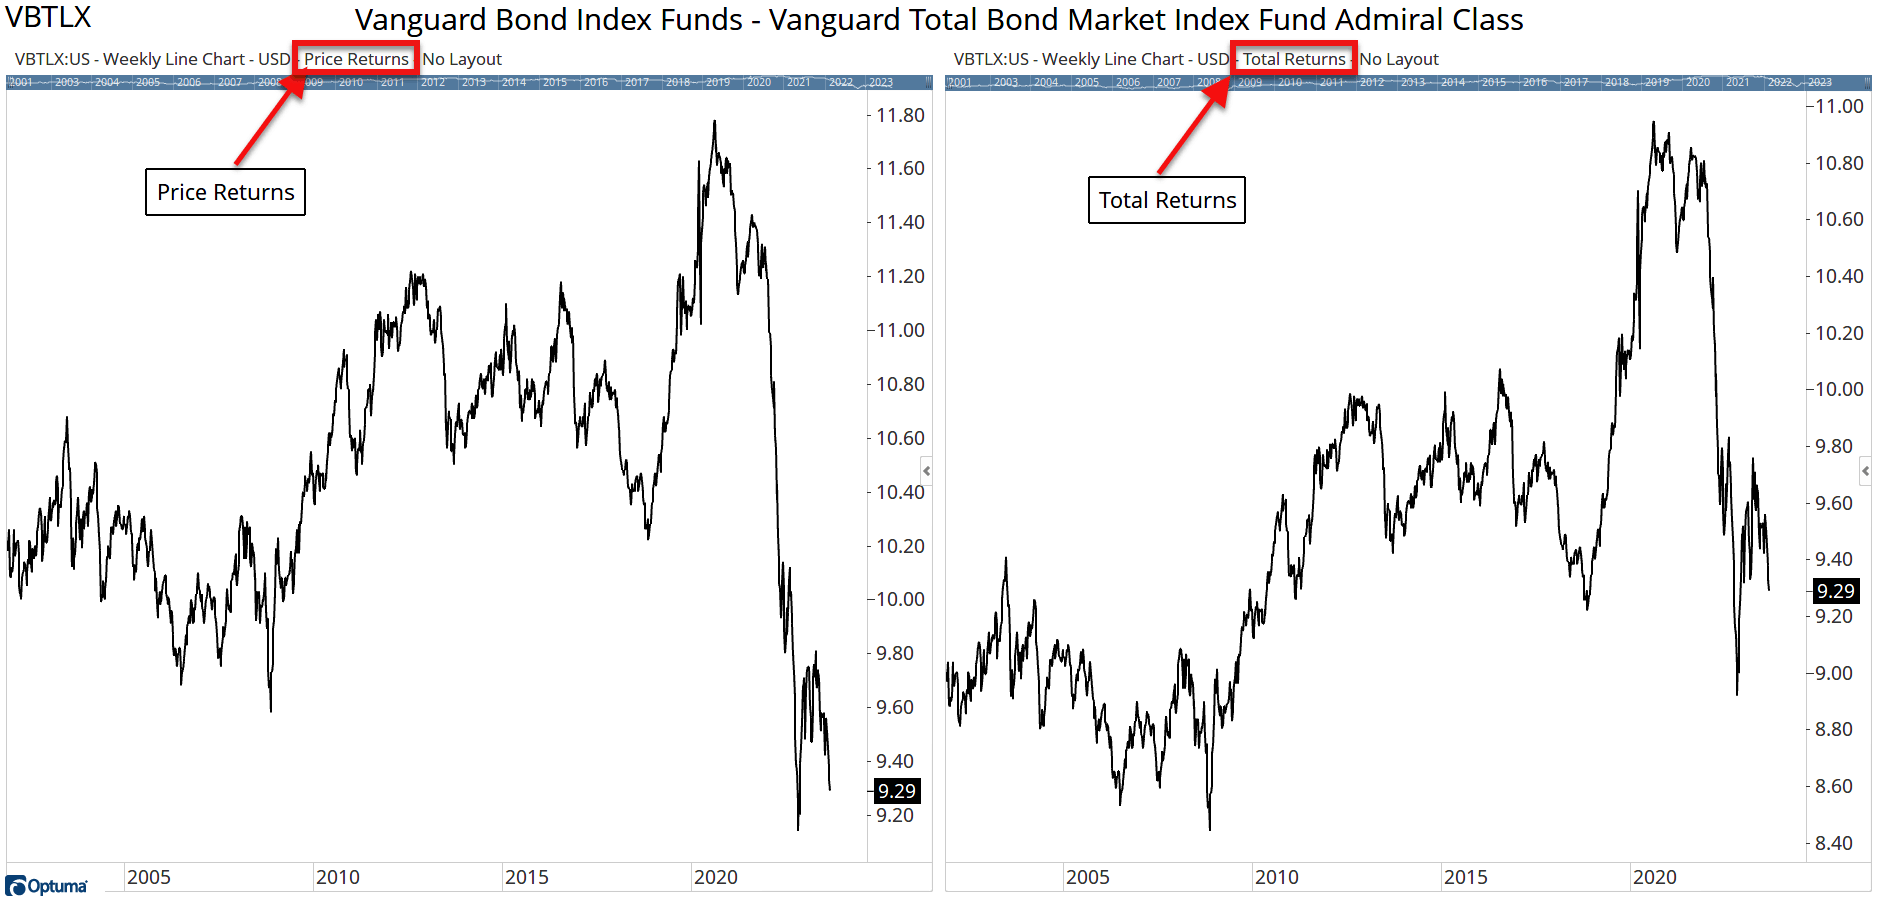 Mutual Funds
Contact support if you have any questions, or would like the new data added to your account. Also, be sure to visit our Sample Workbooks Knowledge Base page where you can download and open lots of chart examples in your copy of Optuma, including ones using these new data options.
![Darren Hawkins]()
Senior Software Specialist at Optuma
Darren is the senior Software Specialist at Optuma based in Brisbane, Australia. Darren grew up in the UK and attended college in the USA where he earned a BA in Economics from St Mary’s College of Maryland. He went on to spend a few years working at the Nasdaq Stock Market in Washington DC. Darren joined Optuma in 2009 after attending an introductory technical analysis course that used the software.


