Multi-Plot Shading
Overview
It’s possible to add a shaded zone between two plot lines using the SHADE() function.
The supported properties for this function are:
- Down Colour: Set the colour of the shaded zone when Plot 1 is lower than Plot 2.
- Up Colour: Set the colour of the shaded zone when Plot 1 is higher than Plot 2.
- Offset: Move the shaded zone forward or backwards (measured in bars).
- Transparency: Allows you to adjust the Transparency of the shaded zone.
Example Scripts
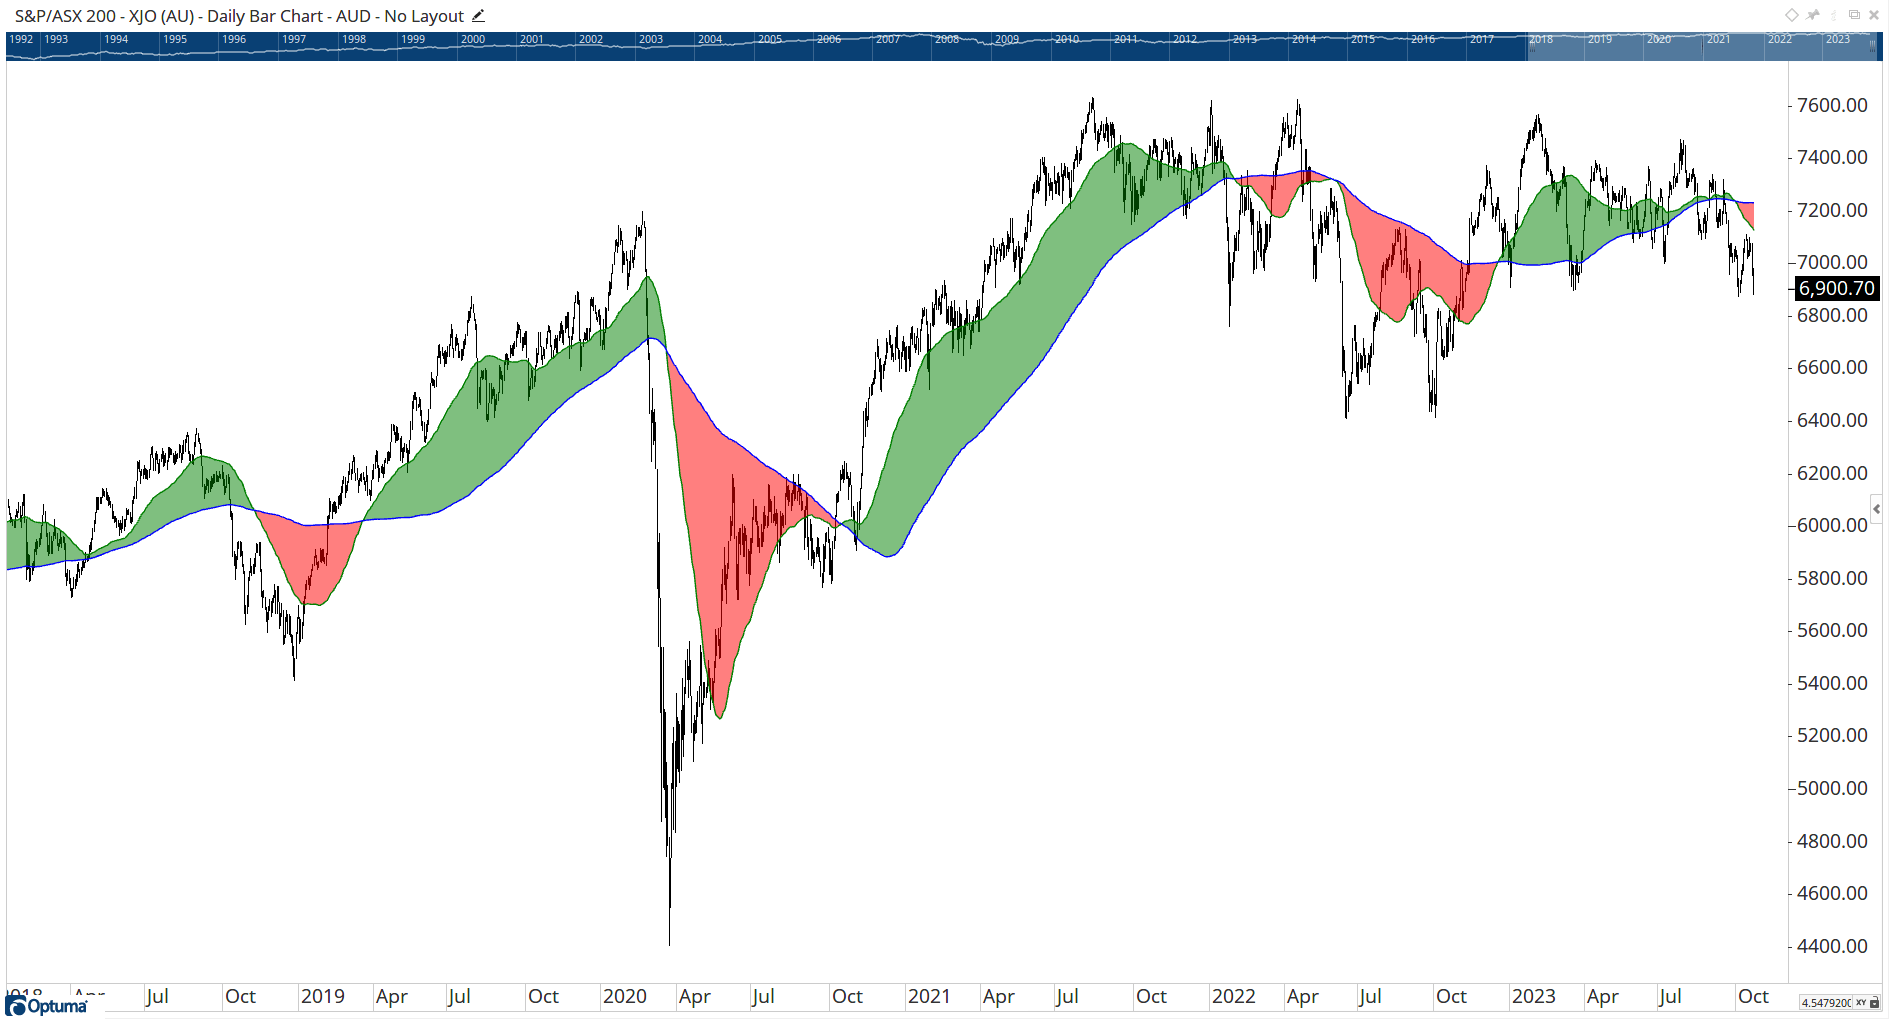
Plot1 = MA(BARS=50, STYLE=Simple, CALC=Close);
Plot2 = MA(BARS=200, STYLE=Simple, CALC=Close);
Plot3 = SHADE(Plot1, Plot2, DOWNCOLOUR=Red, UPCOLOUR=Green);
The above script can be used with a Show Plot indicator to produce the following result, with the difference shaded green when the 50MA is above the 200MA, and red when below:
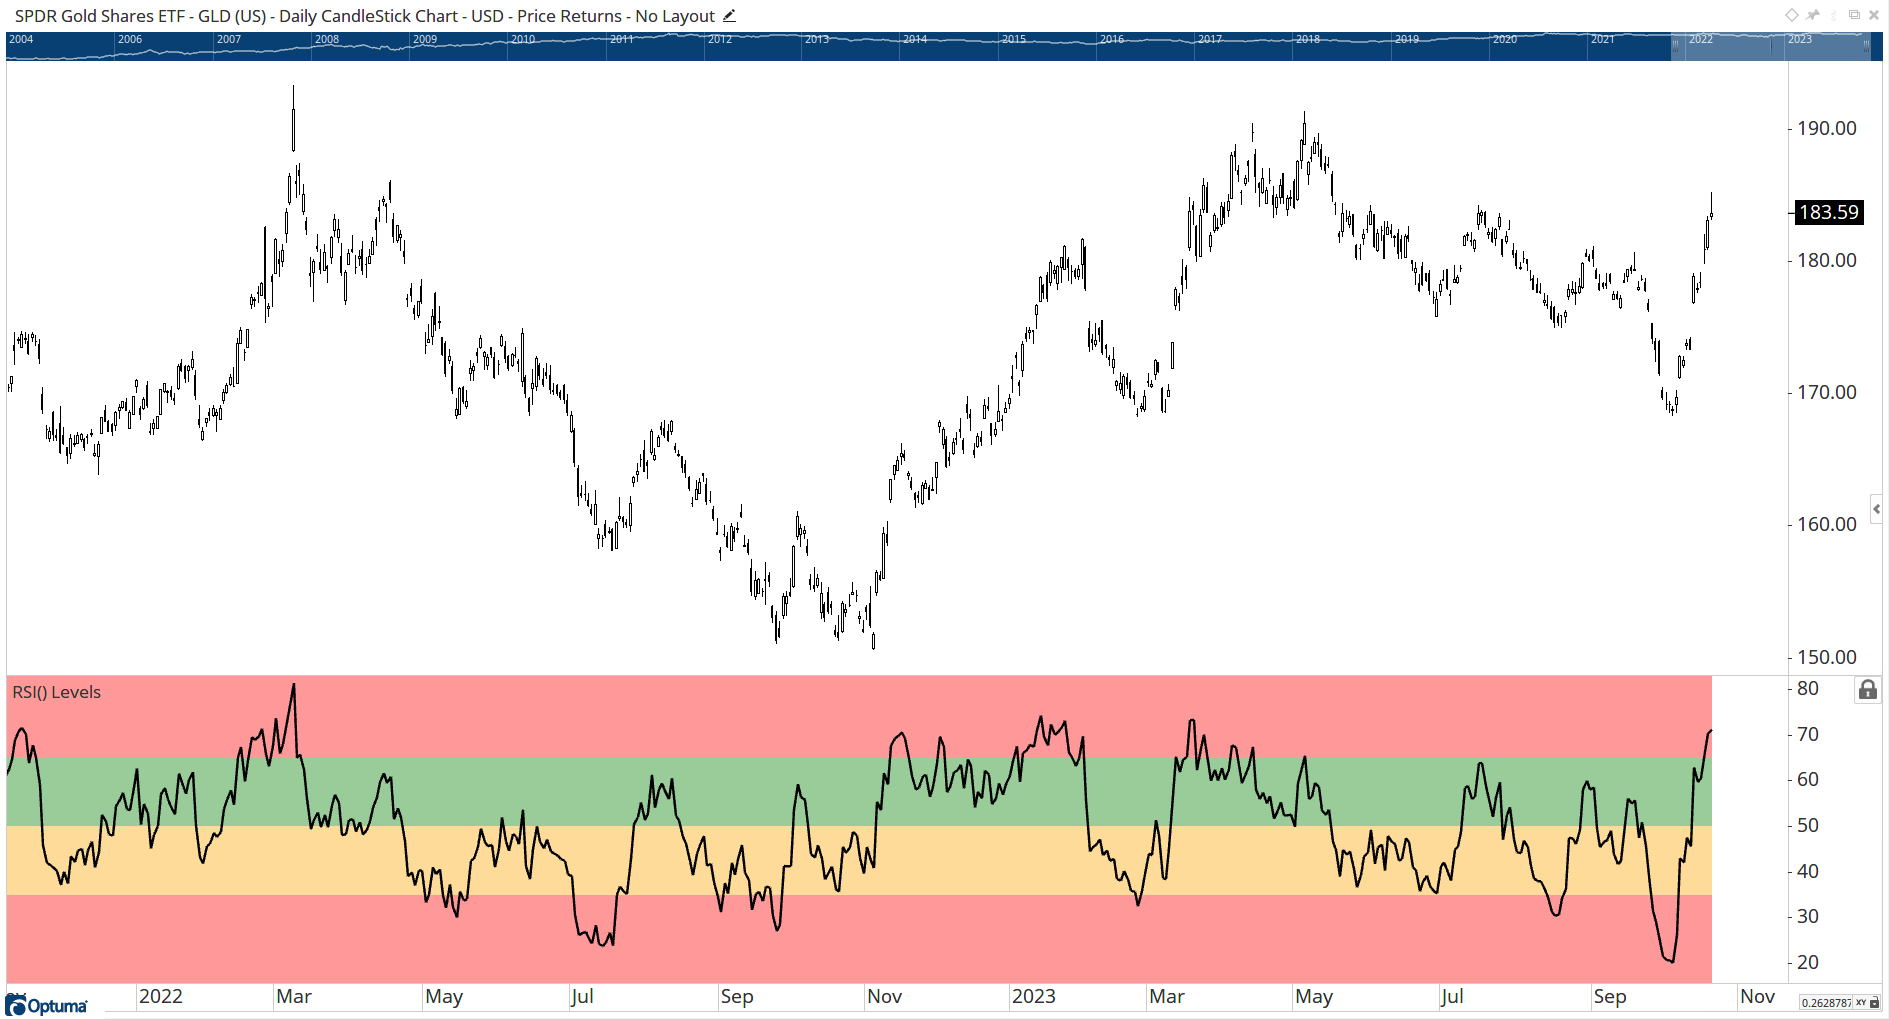
To shade zones of the RSI:
//Get RSI;
V1=RSI(BARS=14);
Plot1= V1;
Plot1.Colour = Black;
Plot1.LineWidth = 2;
//Set RSI Levels;
Plot2 = 0;
Plot3 = 35;
Plot3.Transparency = 0;
Plot4 = 50;
Plot4.Transparency = 0;
Plot5 = 65;
Plot5.Transparency = 0;
Plot6 = 100;
//Set Colours;
SHADE(Plot2,Plot3, SHADEALPHA=40, DOWNCOLOUR=Red) and
SHADE(Plot3,Plot4, SHADEALPHA=40, DOWNCOLOUR=Orange) and
SHADE(Plot4,Plot5, SHADEALPHA=40, DOWNCOLOUR=Green) and
SHADE(Plot5,Plot6, SHADEALPHA=40, DOWNCOLOUR=Red)