Linear Regression Function - LRVAL()
Overview
The LRVAL() function can be used to calculate the value of the Trailing Linear Regression tool. It calculates the correlation of the closing prices around the linear regression line over the last X bars (10 by default, based on closing prices), ranging from +1 (positive slope) and -1 (negative slope). A value of 0 will be horizontal.
Examples
In this example of the S&P500 Sector ETFs, LRVAL(BARS=20) has been added to the watchlist and Show View:
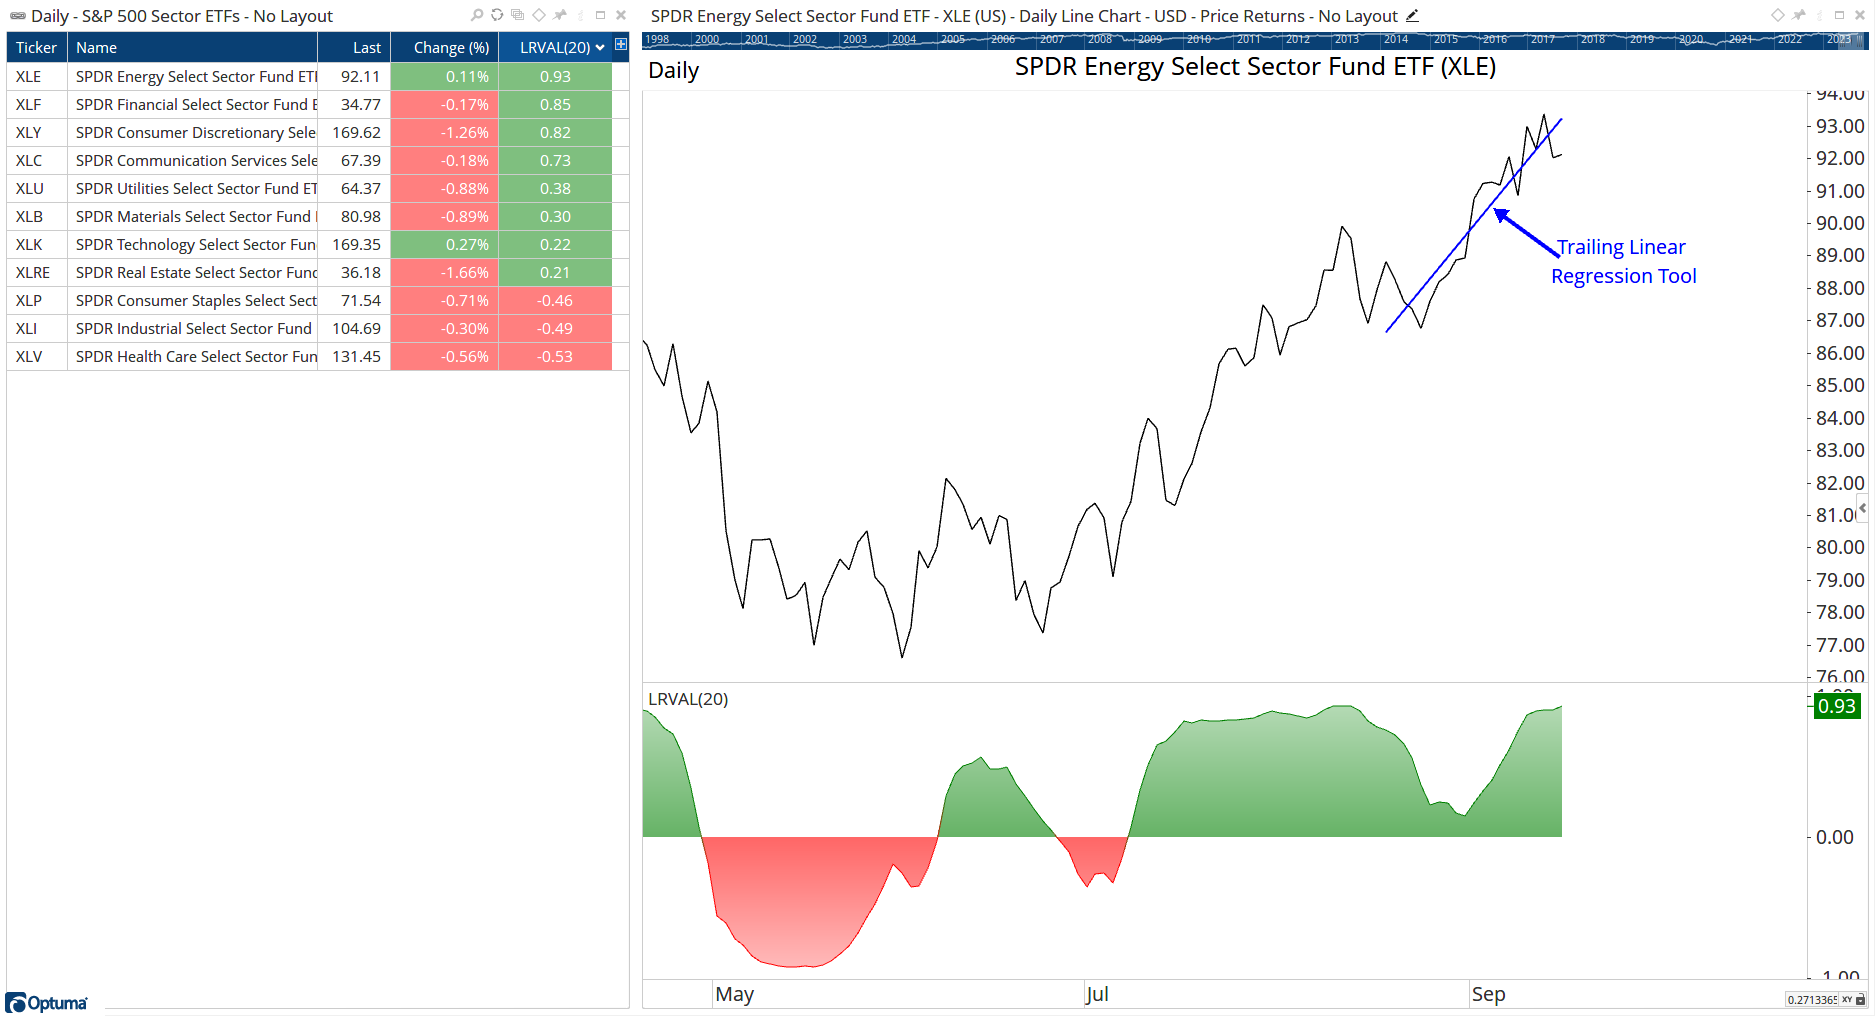
When sorted by the column, Energy ($XLE) has the steepest upward linear regression over the last 20 days (0.93), with Healthcare ($XLV) the steepest downward slope (-0.53).
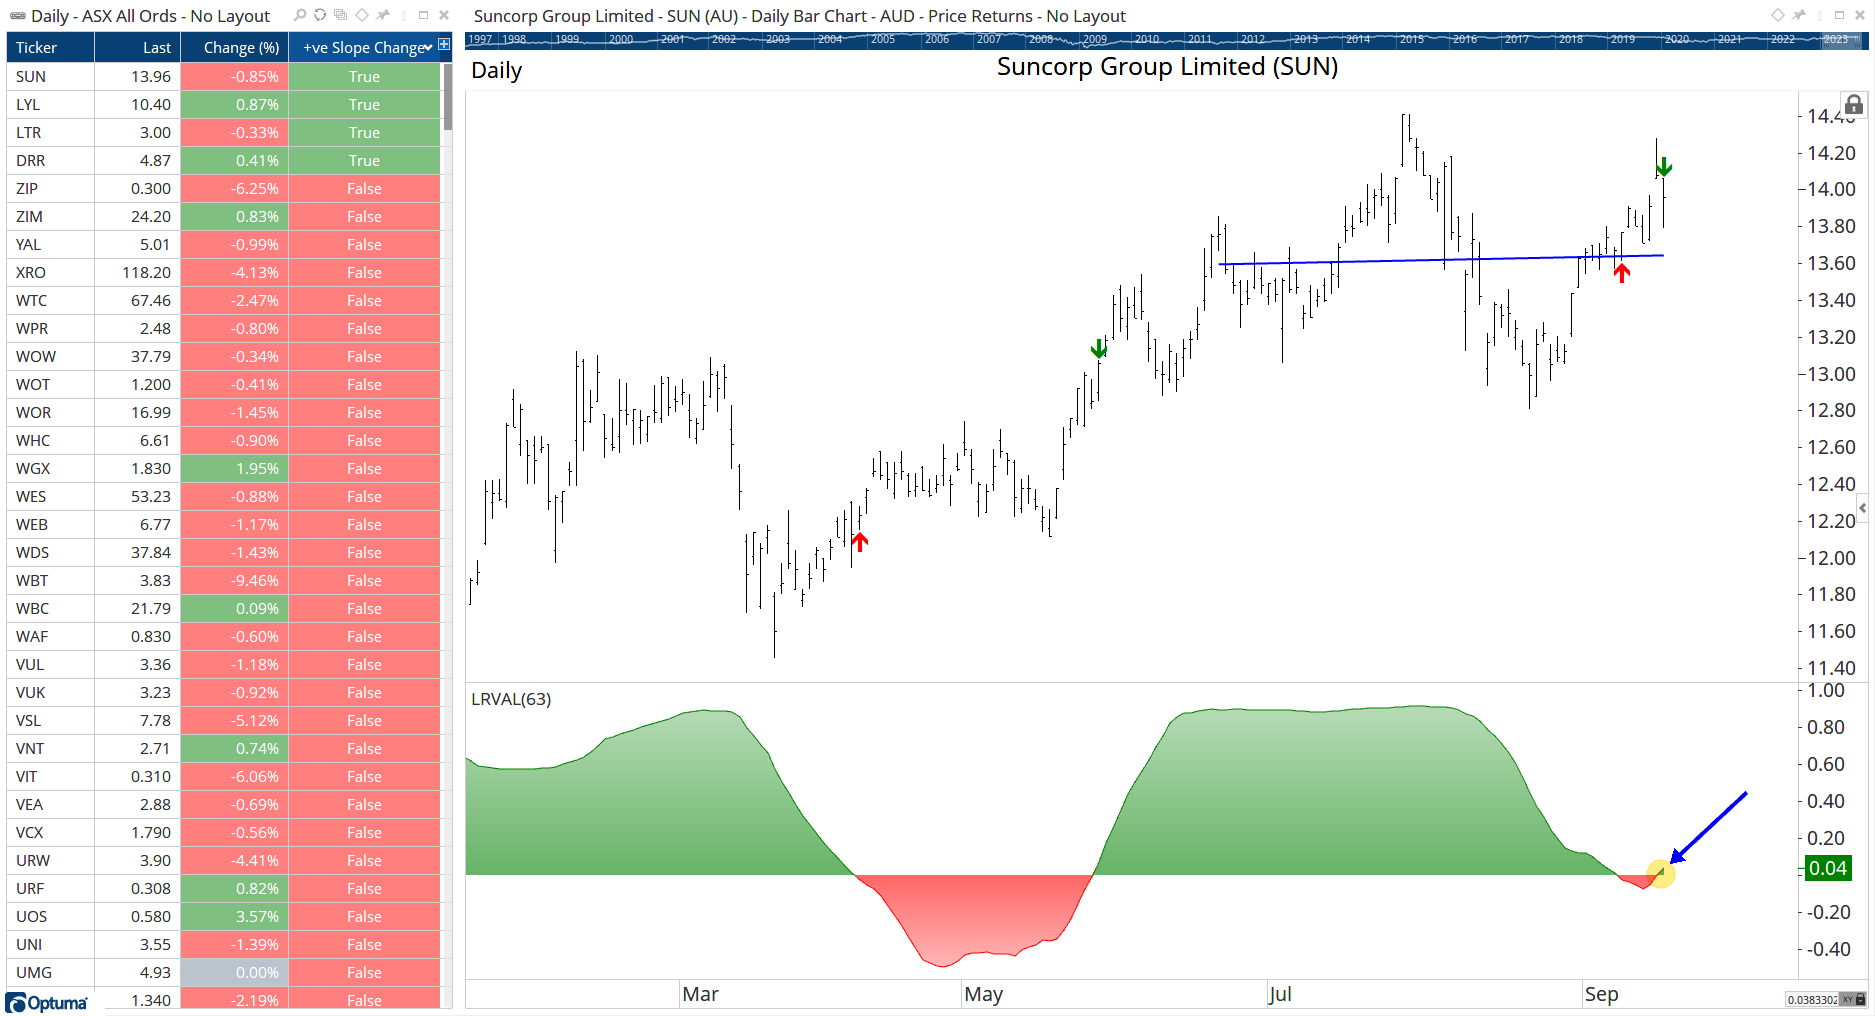
To scan for those stocks that have changed to a postive slope over the last 63 days use the following:
LRVAL(BARS=63) CrossesAbove 0