HIDDEN() Function
Overview
The HIDDEN() function, in conjunction with the IF() function allows you to hide a plot until certain criteria are met.
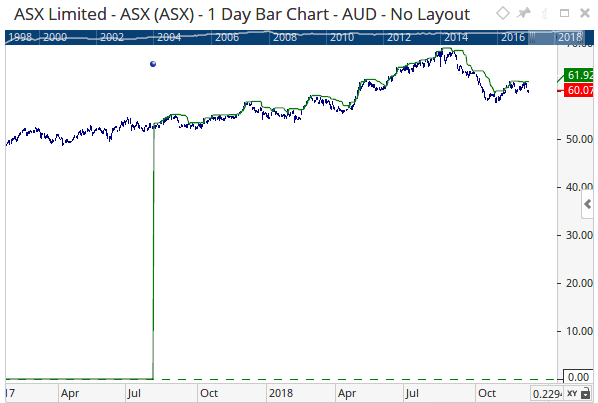
For example, if a tool has been setup to plot from a specific date via a Points() script. Before the HIDDEN() function was available you would need to use scripts where the plot was zero until the selected date:
v=Points().Point1.DateTime;
plot1 = If(BARDATE() > v, HIGHESTHIGH(), 0);
The resulting plot on the chart would look like this:
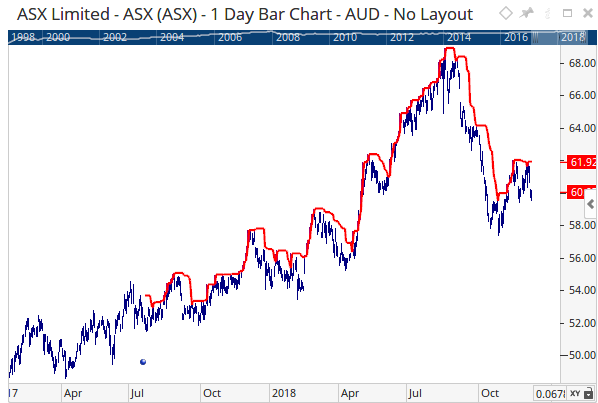
By changing the 0 in the above script to HIDDEN() we can remove the plots zero values and only show the line from the selected date forward.
V=Points().Point1.DateTime;
V1 = If(BARDATE() > v, HIGHESTHIGH(), HIDDEN());
V1
With the updated script the chart now displays the following: