Custom Code Builder
Overview
The Custom Code Builder allows you to enter a script formula to generate a range of chart types, from simple spread charts or custom indices, to the more exotic types of charts, such as complex economic models used by the Federal Reserve (see Advanced Formula examples below).
Once a custom formula code has been created you can create charts or add to a watchlist just like a normal data file from the Security Selection window (located under the Custom Codes exchange).
Video
This video is pulled from the Optuma 101 course that you can access here. This course takes you through the basics of Optuma and helps you get up and running and using Optuma to its full potential. In this video, you will learn how to open, build and edit Custom Codes in Optuma.
Creating a Custom Code
-
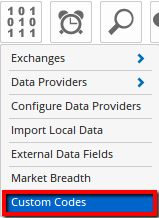
To access the Custom Code Builder go to the Data menu then select Custom Codes.
-
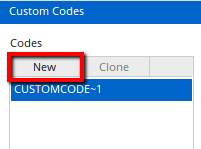
Next, click the New button to start your new Custom Code.
-
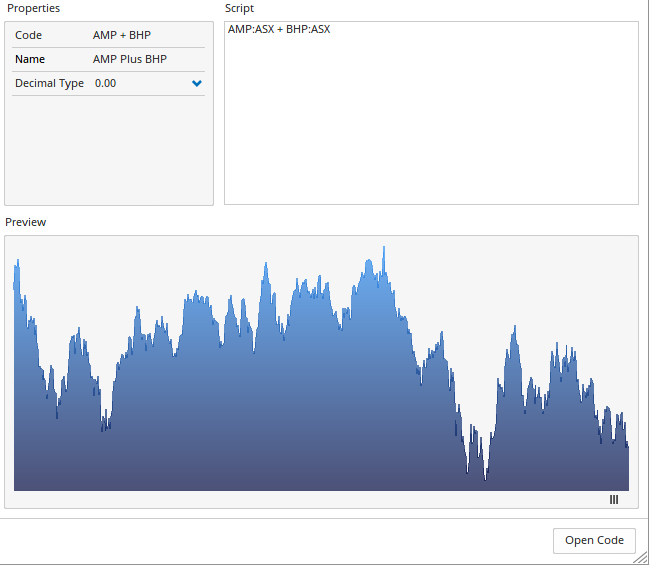
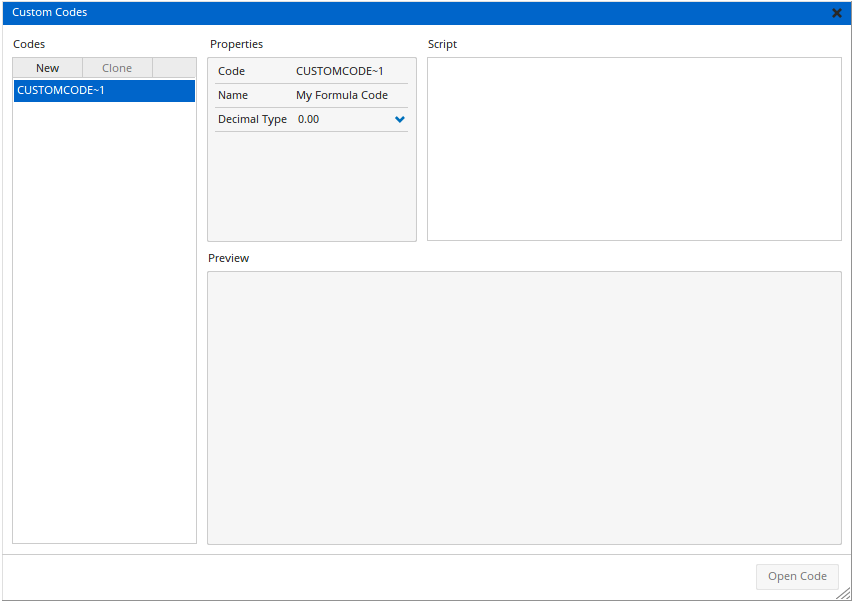
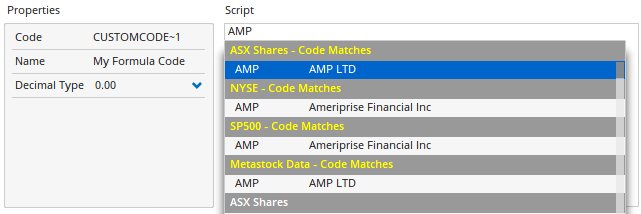
In the Script window enter the script that you want to use, e.g BHP+RIO from the ASX. As you start typing the script the suggested security codes and functions will be displayed below for you to select from. Enter the Code, Name, Decimal Type, and Currency in the Properties box. A preview of the chart will appear below the setup window.
-
Click Open Code to open the chart (it will display as a line chart by default).
Advanced Formula Custom Codes
The Custom Code can include indicators such as moving averages, RSI, or basic scripts to determine a code’s weighting when creating a custom index.
Example 1:
(0.35 * AAPL:US) + (0.25 * MSFT:US) + (0.2 * IBM:US) + (0.2 * TSLA:US)
The above will create a custom weighted index comprised of 35% Apple, 25% Microsoft, and 20% each of IBM and Tesla.
Example 2:
POWER(NVDA:US * AAPL:US * GOOGL:US * MSFT:US * AMZN:US, POWER=1/5)
This example will draw an equal-weighted index of these 5 tickers. For more information on creating custom indices click here.
Example 3:
((SPX:WI)-(MA(BARS=50, CALC=Close, SPX:WI))) / (MA(BARS=50, CALC=Close, SPX:WI)) * 100
This example will draw a chart based on the percentage difference between the price and 50-period moving average of the S&P500 Index.
Example 4:
PCE1 = GETDATA(TIMEFRAME=1 Month, CODE=CPILFESL:FRED);
PCEYOY = ROC(PCE1, BARS=12);
1.4 * (PCEYOY - LNS14100000:FRED) + 8.5
For clients connected to the FRED Database, this example will create a chart based on the Mankiw Rule used in monetary policy.
Deleting Custom Codes
From the Custom Codes window, roll your mouse over the code you wish to remove, then click the red x.