Now Available: Short Interest Data for US and Australian Equities
Clients with Australian or US fundamental data enabled on their accounts now have access to short interest ...
Following on from the additional ETF data that was recently added to our database, we're pleased to announce that we are now able to provide net fund flow data for ETFs listed on a number of exchanges.
Following on from the additional ETF data that was recently added to our database, we’re pleased to announce that we are now able to provide net fund flow data for ETFs listed on a number of exchanges. Clients with Equity and Fundamental data enabled on their account (e.g. US, London - we’re working on ASX) will have access to these net flow timeframes:
| Data | ||
|---|---|---|
Investors and analysts watch fund flows as investor sentiment within specific asset classes, sectors, or the market as a whole. For instance, if net fund flows for bond funds during a given month are negative by a large amount, this signals broad-based pessimism over the fixed-income markets.
A couple of things to note: fund flows do not reflect the performance of the investment, only how investors move their money. Outflows reflect redemptions - or when investors take their money out of a fund - and fund expenses, while inflows reflect fund purchases. Net fund flows are the difference between the inflows and outflows.
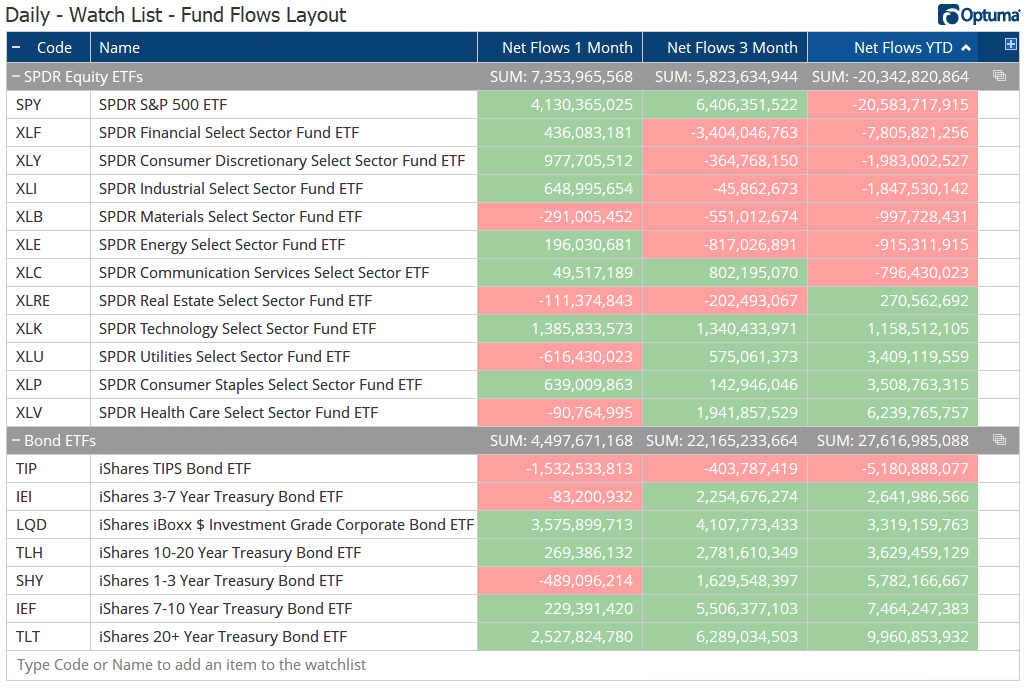
In this example, three net flow timeframes have been added to a watchlist of the SPDR sector and bond ETFs:
 Net Flows
So far this year, the SPDR S&P 500 ETF ($SPY) has had $20.6 billion pulled out of the fund (see the Net Flows YTD column). Of the sectors, Financials ($XLF) has lost $7.8 billion year-to-date, with Health Care ($XLV) gaining $6.2 billion. Over the last month, Technology ($XLK) has gained $1.4 billion and is now positive year-to-date. Not surprisingly given the equity market conditions for the majority of the year, more money has flowed in to bonds, with $27.6 billion flowing in to the seven listed ( a third of that in to iShares 20+ Year Treasury ETF ($TLT) ).
Note: to access this ETF data requires a subscription to both the US Equities and US Fundamental data. Log in to your account page to view your and modify your data options, or contact Support for help.
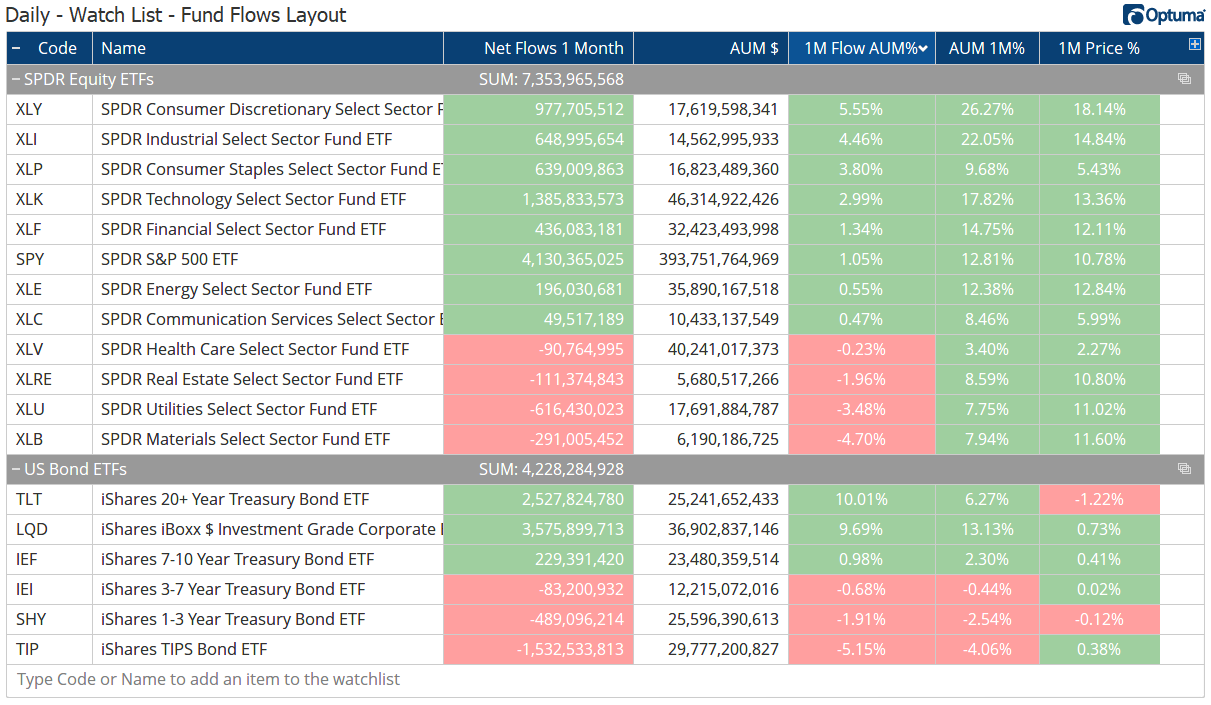
Of course, some funds are bigger than others so one way to compare net flows across funds is to calculate it as a percentage of Assets Under Management. This can be calculated in a watchlist column using this formula (using 1 month net flows):
1
2
3
NF1=DATAFIELD(FEED=FD, FIELD=NetFlows1Month, LATESTONLY=True);
AUM1=DATAFIELD(FEED=FD, FIELD=AssetsUnderManagement, LATESTONLY=True);
NF1 / AUM1
Over the last month, Consumer Discretionary ($XLY) has gained 5.6% of its assets from inflows, which - combined with a price gain of 18% - led to a 26% gain in Assets under Management (AUM). By contrast, the iShares TIPS Bond ETF ($TIP) lost 5% of their AUM.
 AUM Pct
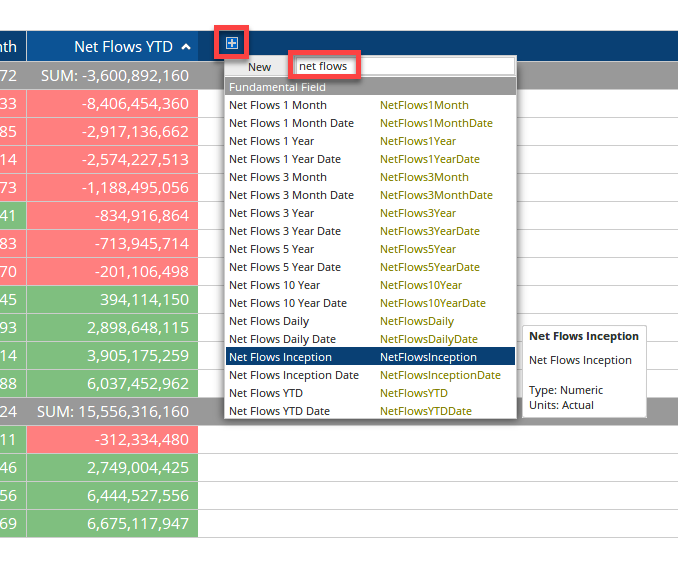
To add the data to an ETF watchlist, click the + to add a column, and in the search box type ‘net flows’ to select the required field from the Fundamental Field list:
 Watchlist
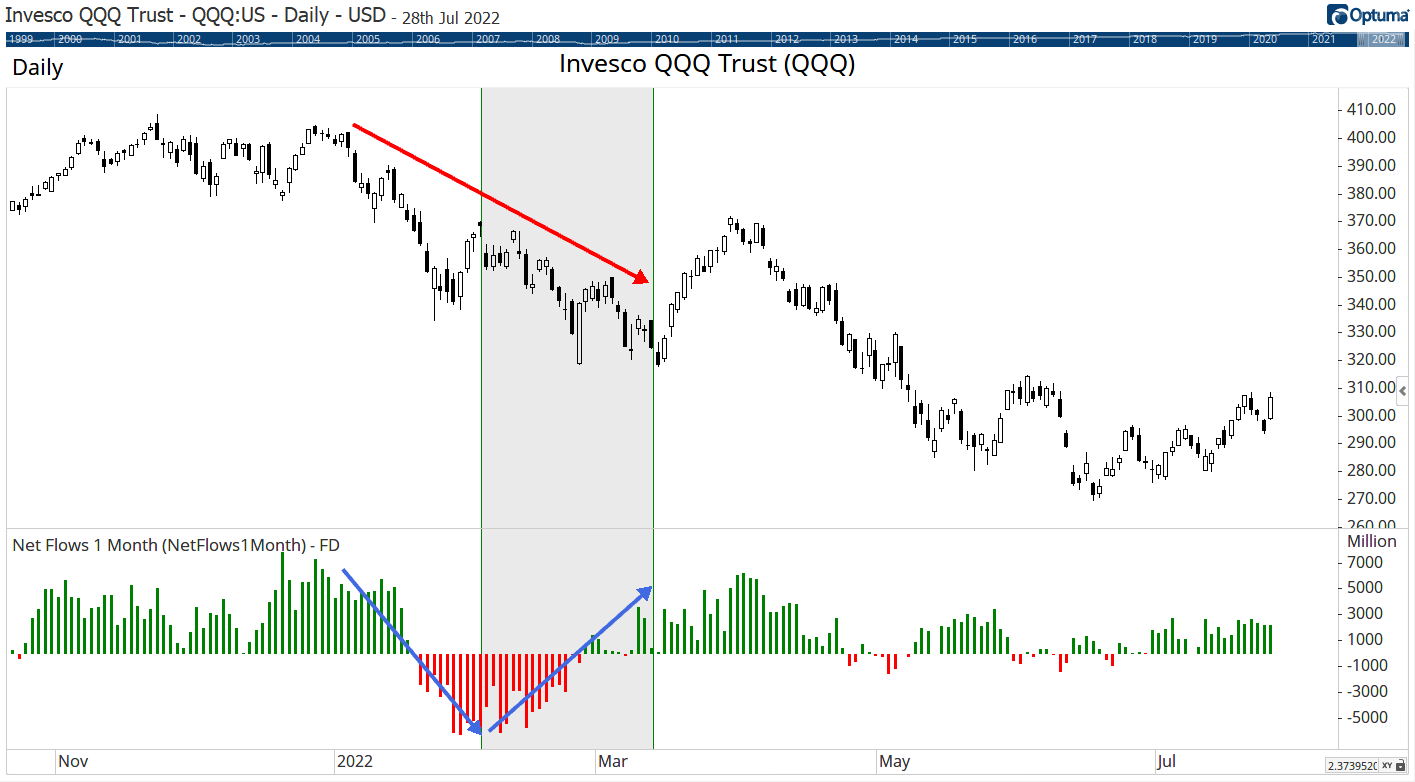
One way to use this data is to by looking at divergences for potential changes in trend.
Here’s an example in the Invesco QQQ Trust ($QQQ) which tracks the Nasdaq 100 index. Both the price and monthly flows declined at the beginning of the year, but then starting in February fund inflows started to outpace redemptions six weeks before the price bottomed in mid-March. By that time net flows were positive again, helping to push the price higher:
 Invesco QQQ Trust
Clients with US Equity and Fundamental data can click the button below to save and open a workbook containing the SPDR and bond ETFs flows. As always, if you have any questions or need help with anything please contact support.
Get blog updates and Optuma News
