ASX and S&P500 Sector Workbooks
This week saw the quarterly rebalancing in the ASX200 and S&P500 indices. Optuma clients can download and o...
An introduction to Optuma's swing chart capabilities, including how to easily identify trends using colour schemes and scans.
This is the first in a series of articles on using Optuma’s swing charts and overlays - particularly when it comes to creating scripts for scans or testing.
Let’s start off with the basics. A swing chart is a line chart that shows the movement of prices, removing both the time element and price ‘noise’.
We have four types of swing charts (I won’t go into all of them in detail here, but you can click the links below to learn more about them).
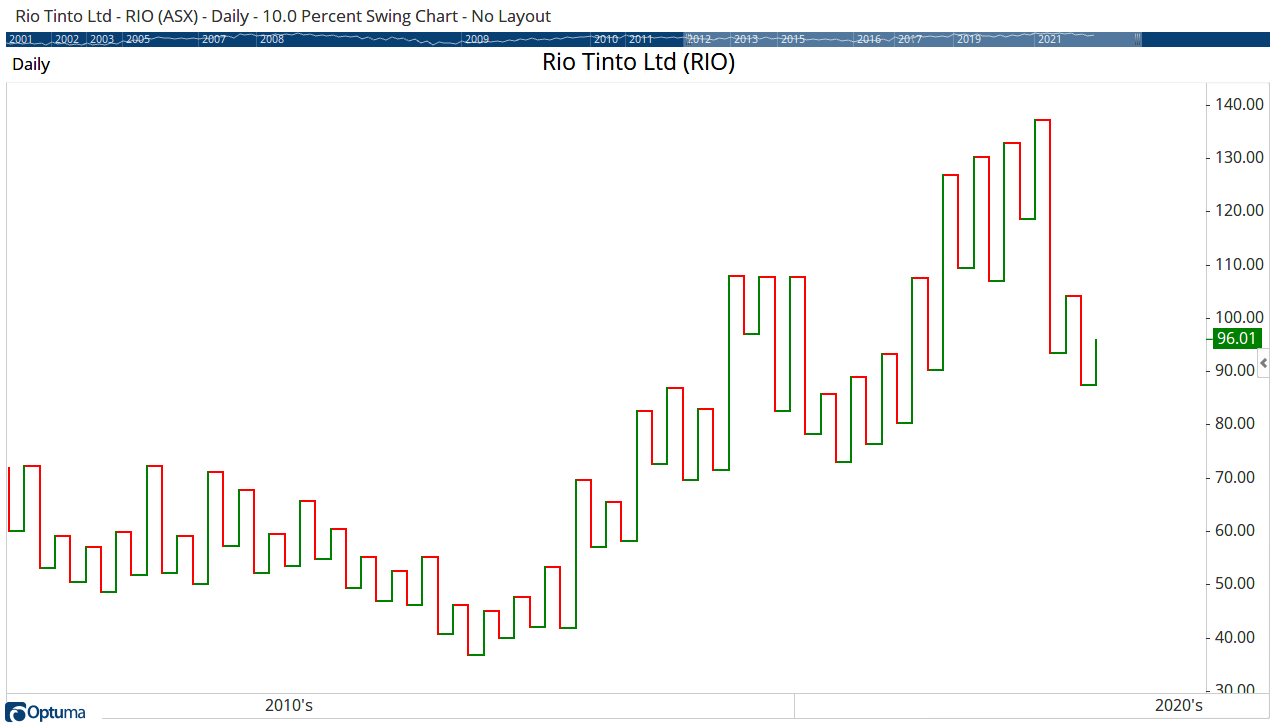
Below is an example of a 10% Percent Swing chart for Rio Tinto ($RIO) on the ASX, which clearly shows support and resistance levels and when higher highs and higher lows occur:
 RIO Swing
In the example above, each swing turn occurs when there is a 10% percent change in price in the opposite direction (of course, you can change this percentage move to anything you like). The current swing for Rio is upwards (green) off of a lower low, and will continue up until the price moves 10% down from the last swing high (currently $96.01), so price would have to fall to $86.41 for a change in direction.
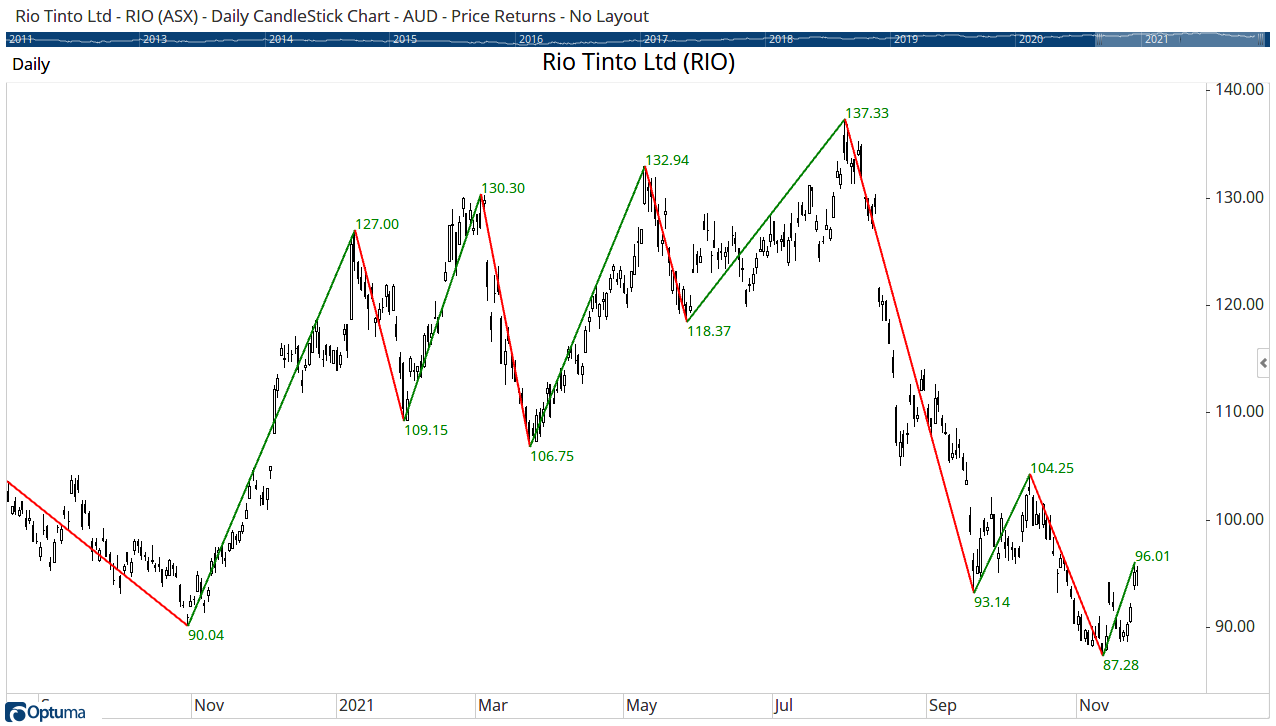
As mentioned above, the time element is removed from the swing charts (notice the lack of dates on the x-axis) allowing you to just focus on price levels. Labels can be enabled on the swing charts to show the dates, prices, and time counts, but it’s also possible to overlay the swings on top of a standard price chart. Here’s Rio with the same 10% swings as above overlaid on the price chart (with the swing values labelled):
 RIO % Swing Overlay
TIP: enable Training Mode with the swing overlay on a chart, and set the date back to earlier in the year. As you advance the chart you will see when the swing changes get confirmed.
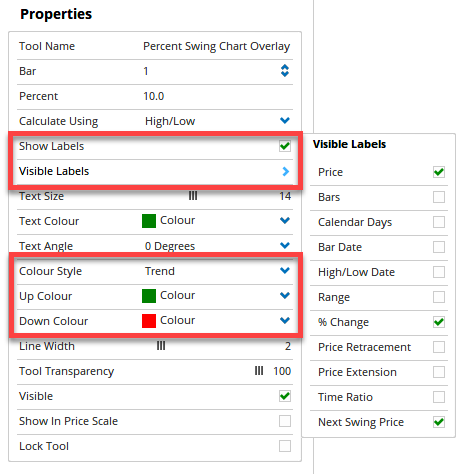
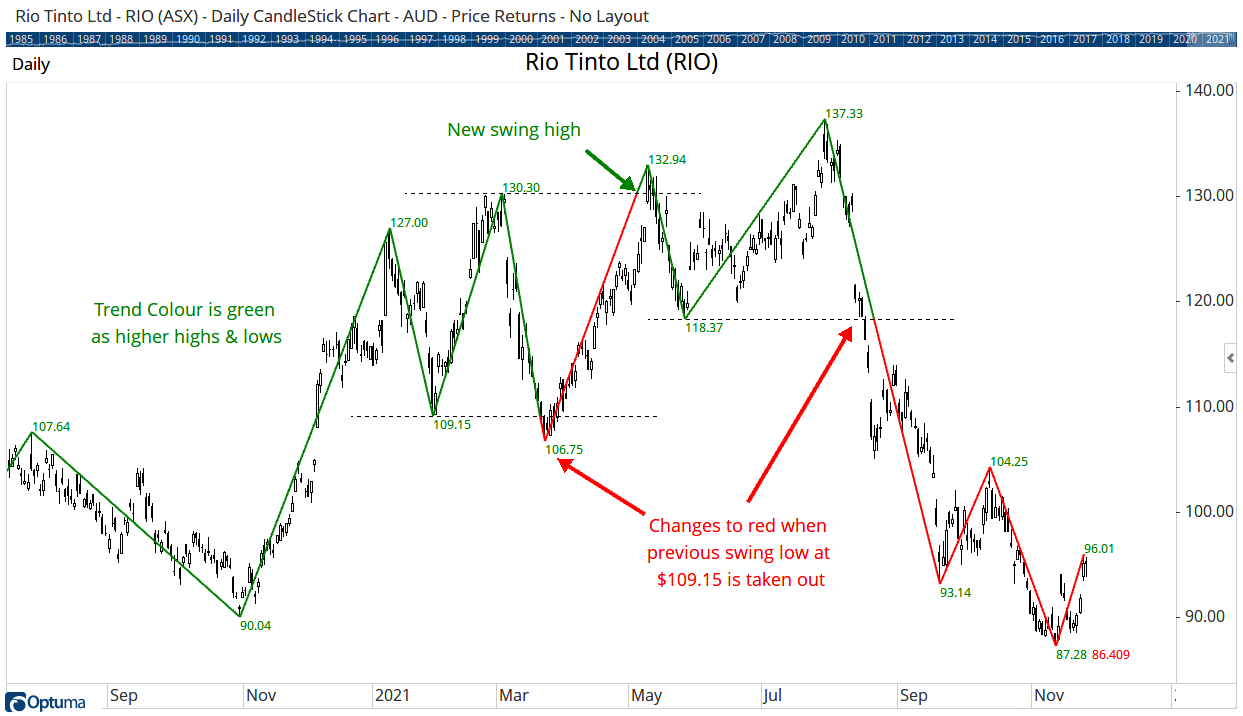
Whilst the current swing on the Rio chart is up, it’s quite obvious that the overall trend is down, because of the previous lower highs and lows. To make it easier to show this trend on a chart, set the Colour Scheme property of the Swing Overlay tool to Trend and the previous swing levels will be taken into account to determine the colour. Here’s how the chart of Rio looks using the Swing Trend colour scheme:
 Overlay Properties
 RIO Tinto Daily
Whilst the current swing is pointing up, the overall trend is down and the overlay is coloured red. The Swing Trend will only turn green when the last swing high (currently $104.25) is taken out.
Using swing formulas in scripting can be quite tricky (we’ll look into those in a future article!), so we’ve made it easier to identify trends by creating SWINGTRENDUP and SWINGTRENDDOWN functions.
When combined with your preferred swing function (e.g. PERCENTSWING(), GANNSWING(), etc.) it is easy to identify current trend direction - or even when the trend changes.
Here’s an example using a 3-bar Gann swing which will show a change in trend - i.e. when the SWINGTRENDUP or SWINGTRENDDOWN condition becomes true (remember a true condition gets assigned a value of 1, so the signal occurs when the value changes to 1, not when it equals 1):
1
2
3
S1 = GANNSWING(SWINGCOUNT=3, METHOD=Use Next Bar, USEINSIDE=False);
SWINGTRENDUP(S1) ChangeTo 1 or
SWINGTRENDDOWN(S1) ChangeTo 1
If you are not familiar with Gann Swings click below for a detailed video by Mathew Verdouw on their construction:
The same script above can be used in a custom colour scheme so that you don’t really even need the tool overlaid (although the labels can be quite useful). Once the S1 variable has been defined only SWINGTRENDUP(S1) needs to be used for the positive trend (green), with the default colour set to red (i.e. when the script is false). Here’s a 3 bar Gann swing trend on Twitter (TWTR):
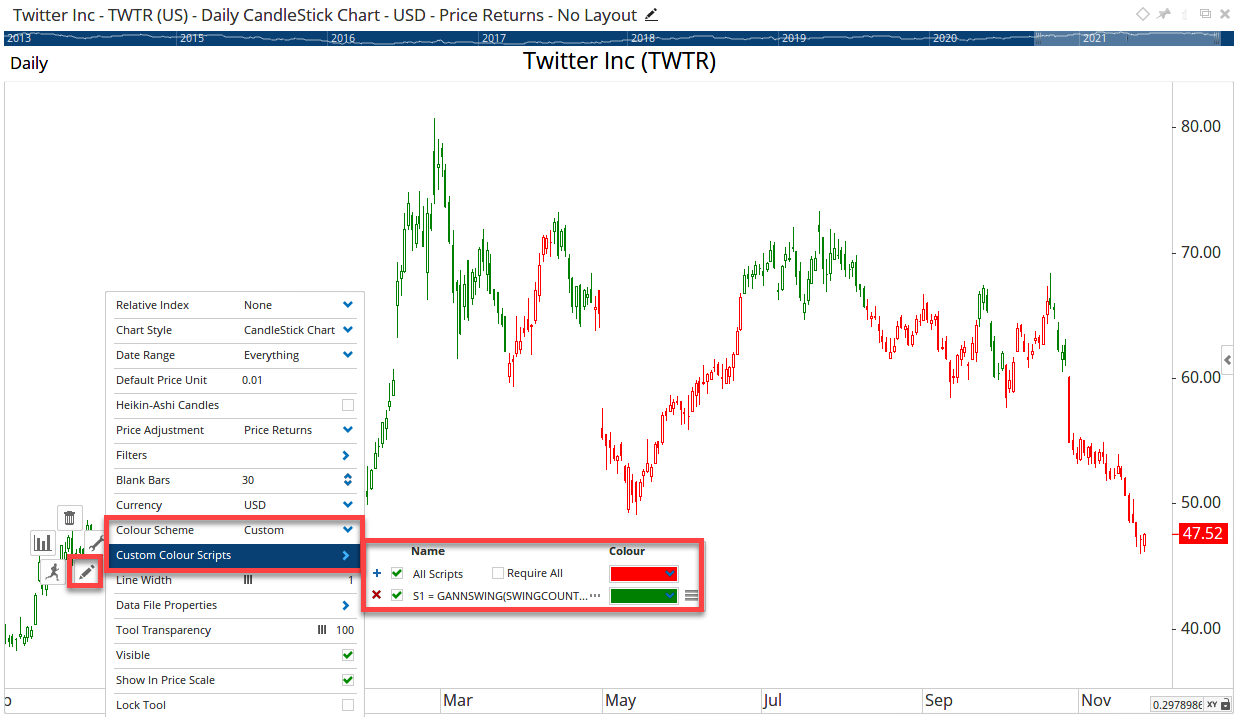 Custom Bar Colours
Even if you are already familiar with swing charts and overlays I hope you found this useful. Next time we’ll get into more advanced swing scripting, but if you have any questions please leave a comment below, and don’t forget to post any scripting queries on our Optuma Scripting Forum.
Get blog updates and Optuma News
