ASX and S&P500 Sector Workbooks
This week saw the quarterly rebalancing in the ASX200 and S&P500 indices. Optuma clients can download and o...
Use the scripting language to identify swing patterns (e.g. higher highs & lows), changes in direction, and swing gaps.
As seen in the previous articles on Optuma Swings (here and here), we can use swing highs and lows (based on percentage, Gann Swings, or Volatility moves) to determine the trend of an index, stock, currency, or commodity. But we can also create script formulas to identify when a change of swing direction is confirmed, and whether the new swing highs or lows are higher or lower than the previous swings. In fact, once we know the swing values we can automatically calculate all sorts of things, such as consecutive higher lows, or swing gaps.
Why is this important? As discussed in the other articles, swing charts make it easy to see trends and strength in the market, so these formulas can help you quickly and easily find particular setups based on changes in trend.
Let’s start off by finding the previous swing values using the SWINGSTART function and offsets.
When looking at swing values it’s important to know the current swing direction.
This means that the same script can return different results if the current direction isn’t taken into consideration. If the current swing is up, then the SwingStart value will be a low, and if the swing is down then it will be a high. Likewise, the offset swing values will be different, so the previous swing start will be a high when the current swing is up, and a low with a downswing.
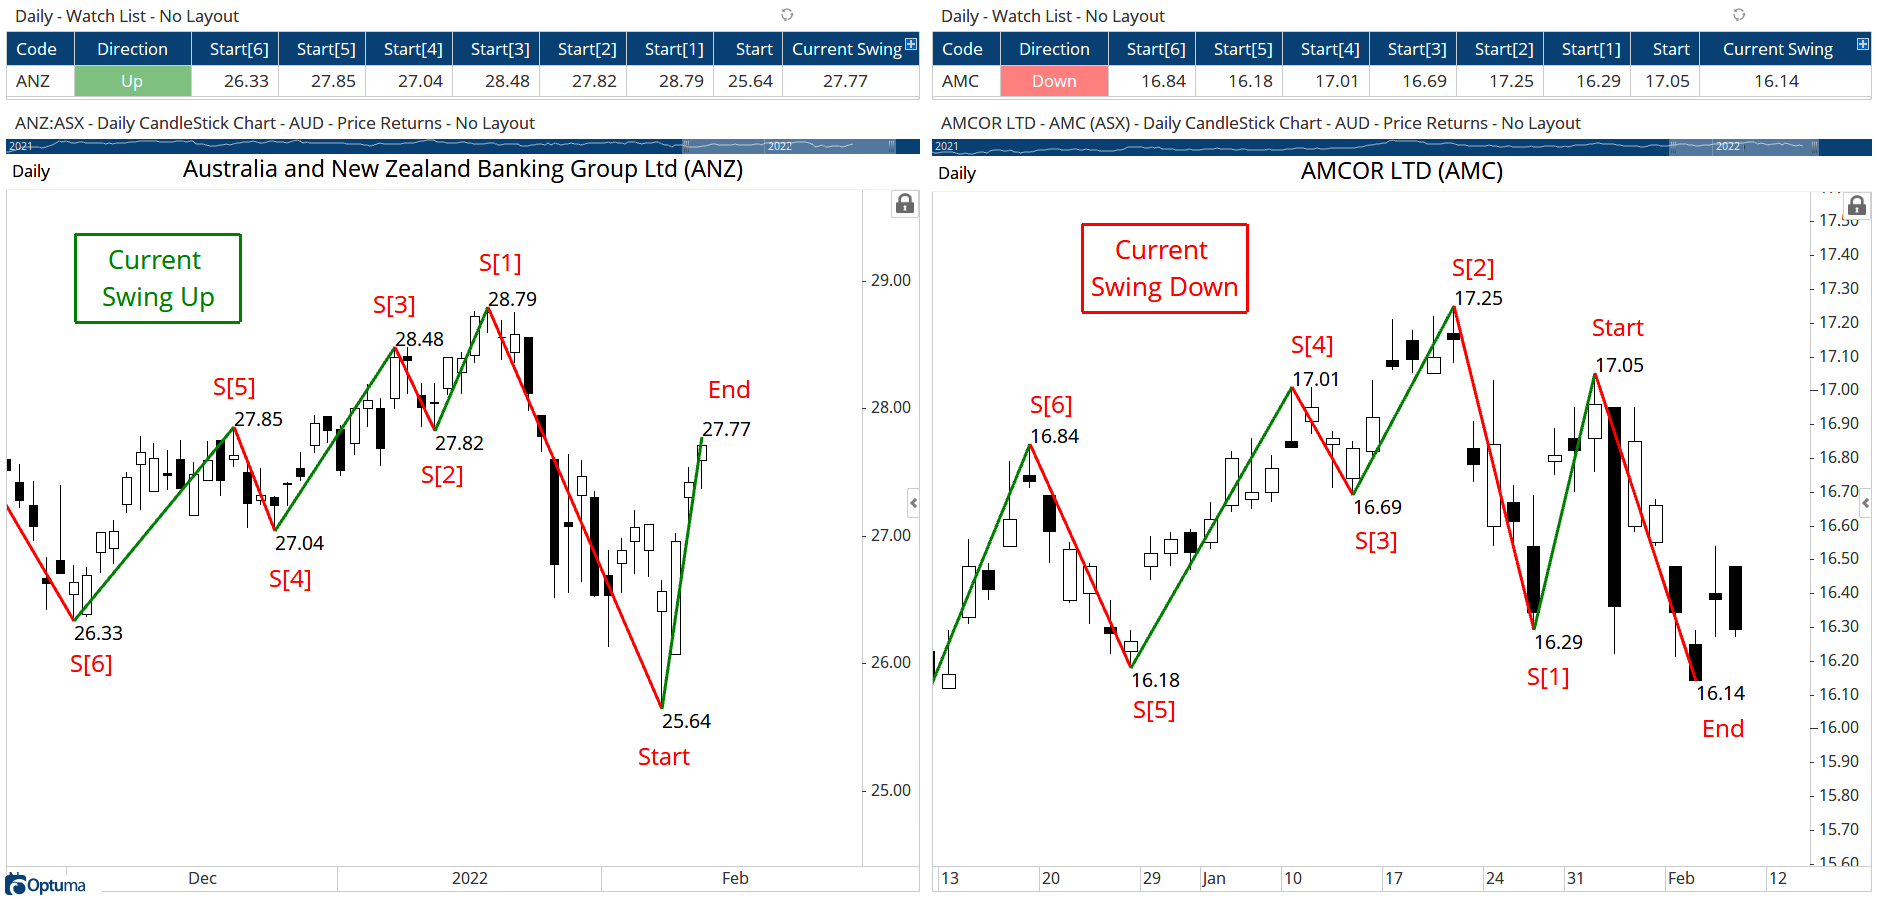
The image below shows the swing high and low values for ANZ on the left (current swing is up) and AMC on the right (swing down).
 SwingStart Values
As you can see, the swing offsets on the left have an even number for the lows (ie S[2], S[4], and S[6]) versus odd numbers on the right (ie S[1], S[3], and S[5]).
Here are the scripts, based on a 3 bar Gann Swing:
1
2
SW1 = GANNSWING(SWINGCOUNT=3, METHOD=Use Next Bar, USEINSIDE=True);
SWINGEND(SW1)
1
2
SW1 = GANNSWING(SWINGCOUNT=3, METHOD=Use Next Bar, USEINSIDE=True);
SWINGSTART(SW1)
1
2
SW1 = GANNSWING(SWINGCOUNT=3, METHOD=Use Next Bar, USEINSIDE=True);
SWINGSTART(SW1)[1]
To get preceding swings start levels increase the offset value in the square brackets, ie [2], [3], etc.
Tip: to copy all the swing data (including dates, price levels, and direction) to Excel open the type of swing chart required (not an overlay) and right-click on the line and select Copy Data to Clipboard from the Actions menu, and then CTRL+V to paste in Excel.
So now we know the swing values (and offsets) we can look for relationships between the swings. For example, you can scan for when a stock is in an upswing with at least two consecutive higher swing lows:
1
2
3
SW1 = GANNSWING(SWINGCOUNT=3, METHOD=Use Next Bar, USEINSIDE=True);
S1 = SWINGSTART(SW1);
SWINGUP(SW1) and (S1 > S1[2]) and (S1[2] > S1[4])
To find two consecutive lower highs with a swing down:
1
2
3
SW1 = GANNSWING(SWINGCOUNT=3, METHOD=Use Next Bar, USEINSIDE=True);
S1 = SWINGSTART(SW1);
SWINGDOWN(SW1) and (S1 < S1[2]) and (S1[2] < S1[4])
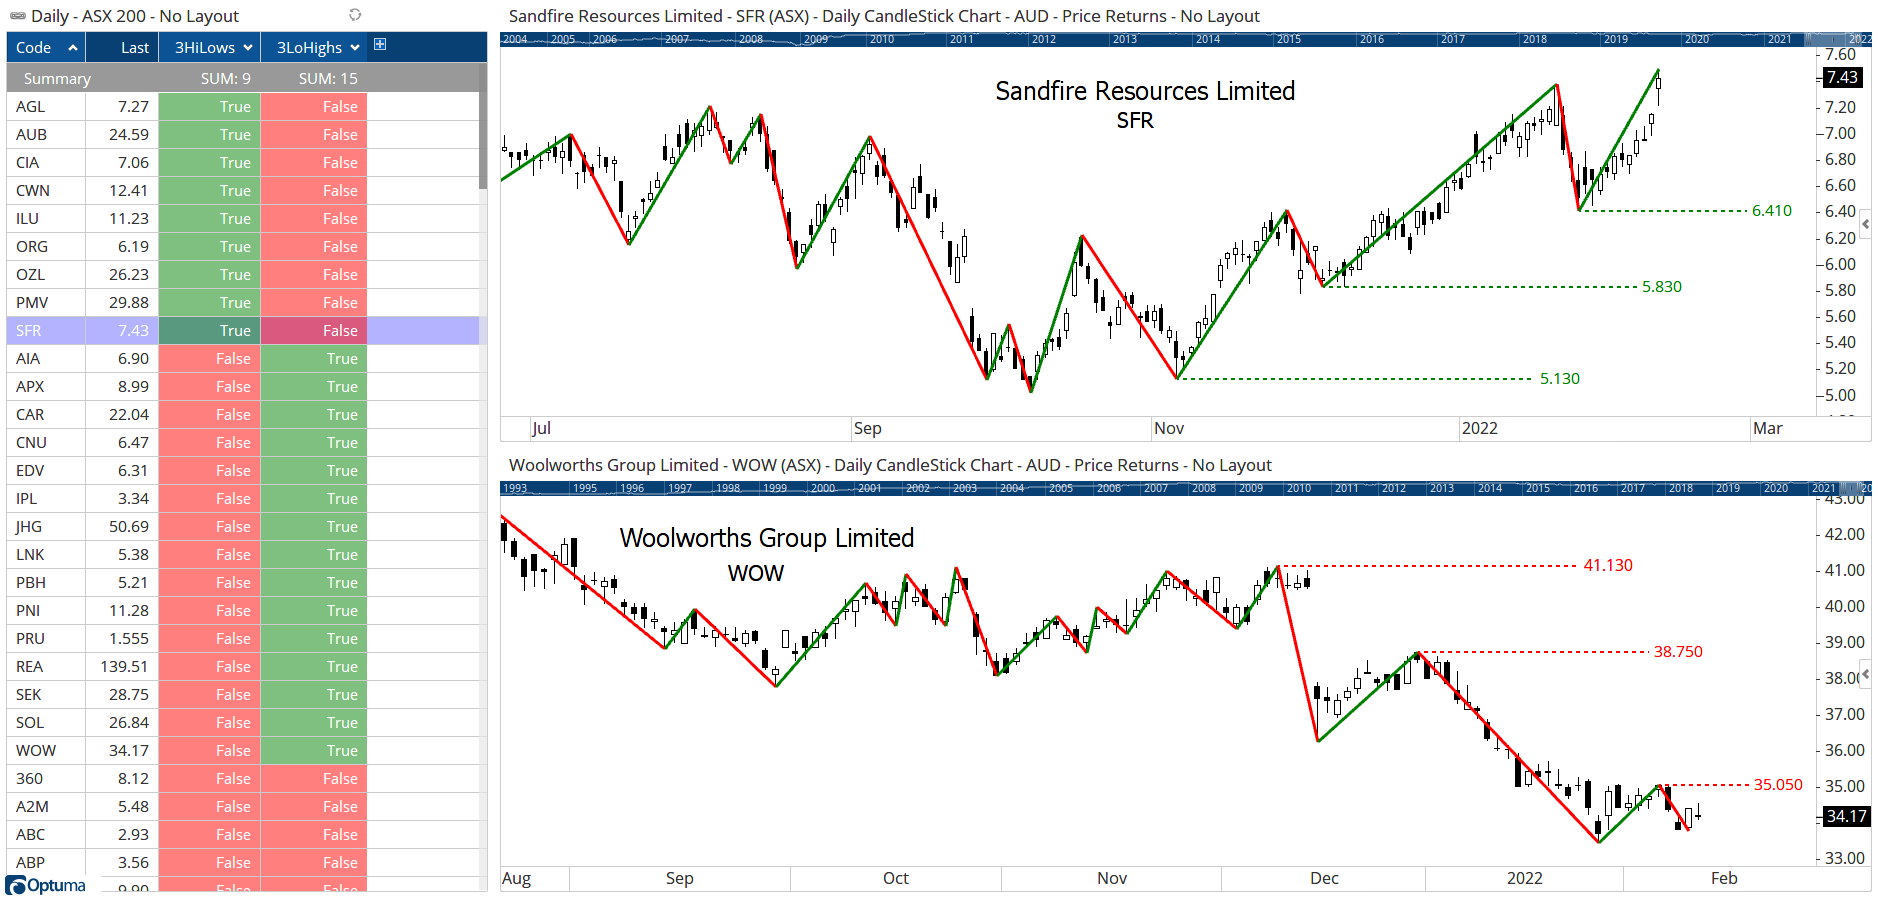
In this example of the ASX200 watchlist, SFR (and 8 others) has at least two higher swing lows, and WOW (and 14 others) with at least two lower highs.
 Higher Lows & Lower Highs
This next example which shows in a watchlist when the latest bar has changed the 10% swing direction from down to up:
1
2
SW1 = PERCENTSWING(PERCENT=10.0);
SW1 TurnsUp
This is useful, but what is more interesting - and potentially shows more strength - is if the new confirmed swing low is higher than than the previous low:
1
2
3
SW1 = PERCENTSWING(PERCENT=10.0);
S1 = SWINGSTART(SW1);
SW1 TurnsUp and (S1 > S1[2])
The third column takes it one step further: not only a higher low but also a new higher high:
1
2
3
4
SW1 = PERCENTSWING(PERCENT=10.0);
S1 = SWINGSTART(SW1);
E1 = SWINGEND(SW1);
SW1 TurnsUp and (S1 > S1[2]) and (E1 > E1[2])
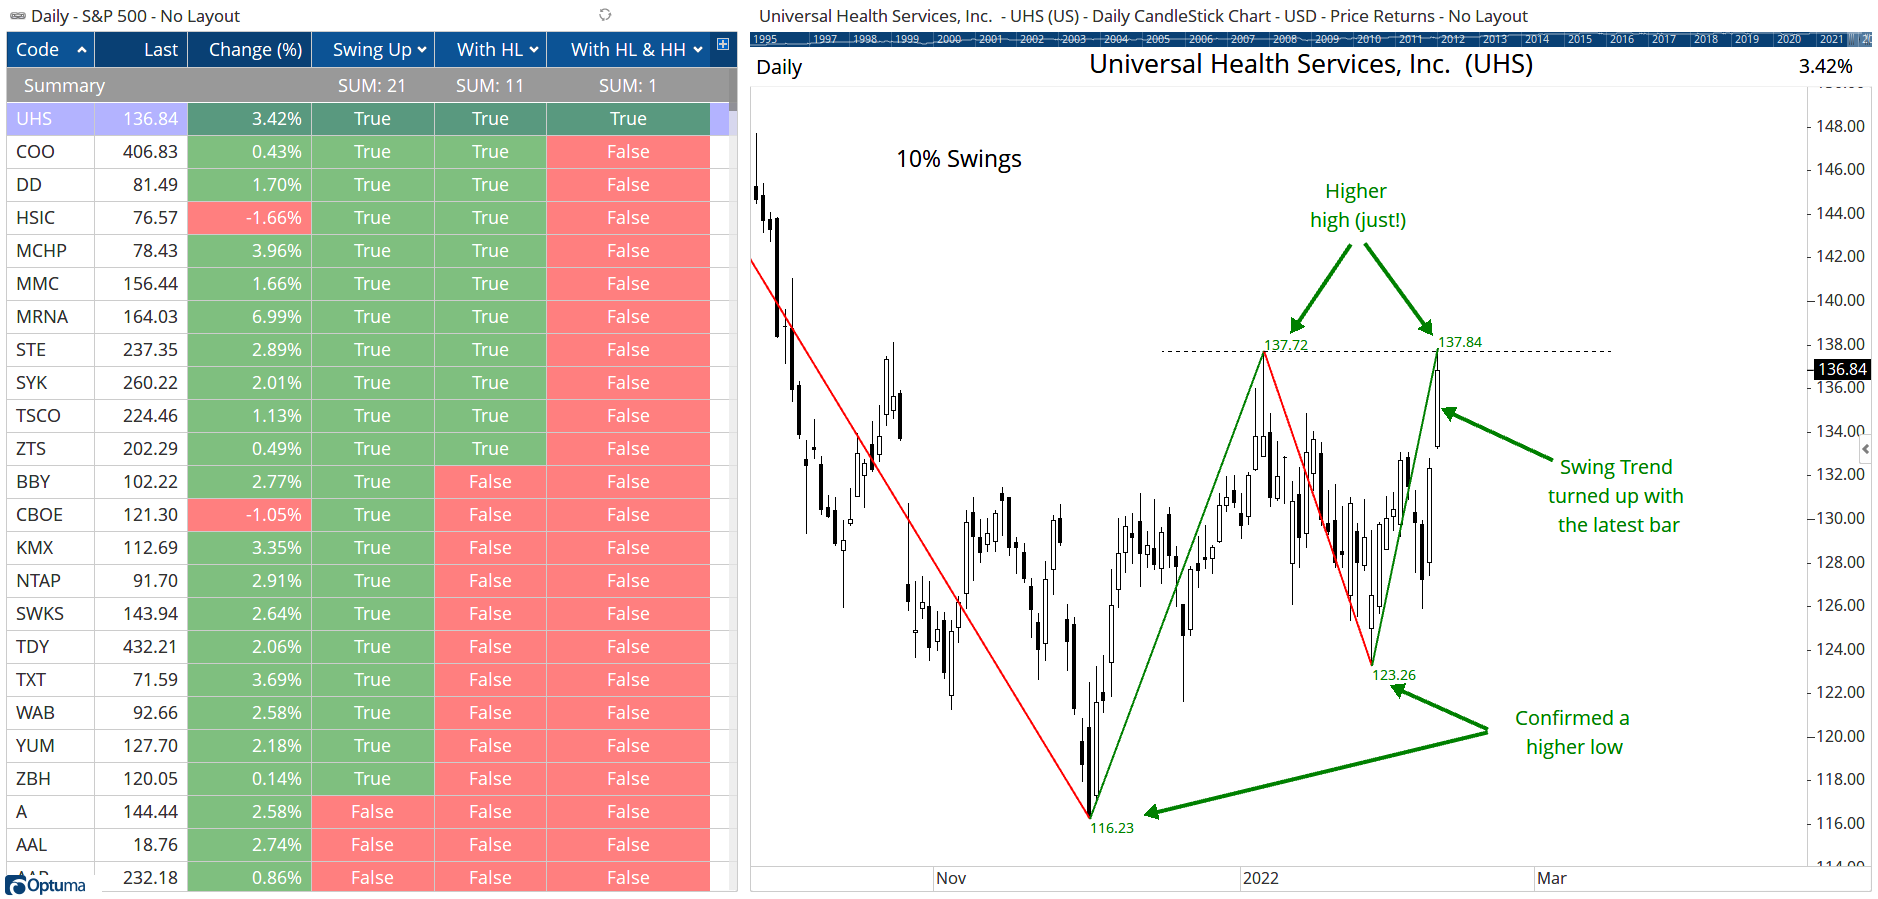
In the image below there were 21 members of the S&P500 whose 10% swing direction turned positive with the day’s price action, of which 11 formed a higher low, and only UHS formed a higher low and a higher high (albeit by only $0.12 - so if you wanted a percentage tolerance could be included in the formula):
 SwingTurns
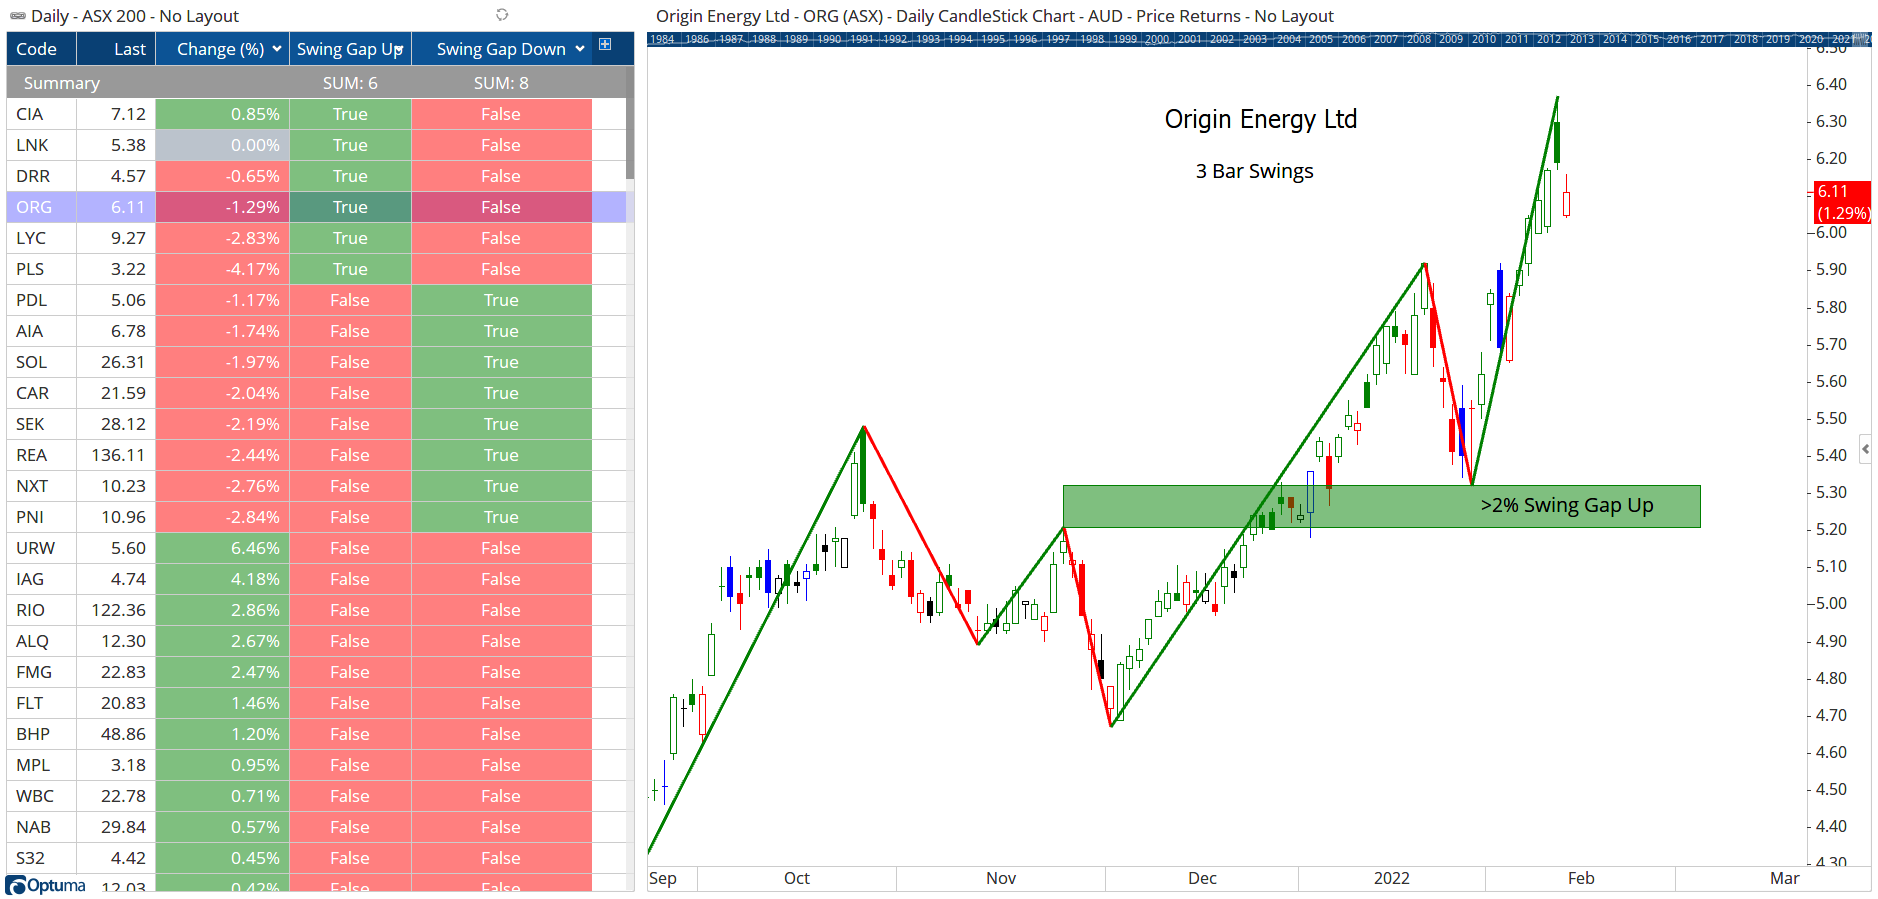
Finally, this will find instances when the last swing low is at least 2% higher than the previous swing high (which requires an offset of 3 in an upswing).
1
2
3
SW1 = GANNSWING(SWINGCOUNT=3, METHOD=Use Next Bar);
S1 = SWINGSTART(SW1);
SWINGUP(SW1) and (S1 > S1[3]*1.02)
1
2
3
SW1 = GANNSWING(SWINGCOUNT=3, METHOD=Use Next Bar);
S1 = SWINGSTART(SW1);
SWINGDOWN(SW1) and (S1 < S1[3]*0.98)
 Swing Gaps
Hopefully these examples will help you with your own swing analysis. Click the buttons to download the workbooks with the watchlist formulas so you can open in your copy of Optuma and adjust them to meet your own requirements.
If you have any questions about building your own formulas - not just on swings but on any other technical condition - please search the Scripting Forum and post queries there (provide as much information as you can - images are especially helpful). Alternatively, paid consultations can be arranged where we can build and test the formulas for you. Contact support for details.
Get blog updates and Optuma News
