


Price Return vs Total Return Data
Learn how to view Total Return data in Optuma
3 min read
This week saw the quarterly rebalancing in the ASX200 and S&P500 indices. Optuma clients can download and open workbooks which includes the updated lists of the stocks within each sector along with chart examples.
This week saw the quarterly rebalancing in the Australian S&P/ASX 200 and US S&P500 indices. Here are the changes that came into effect on March 24th:
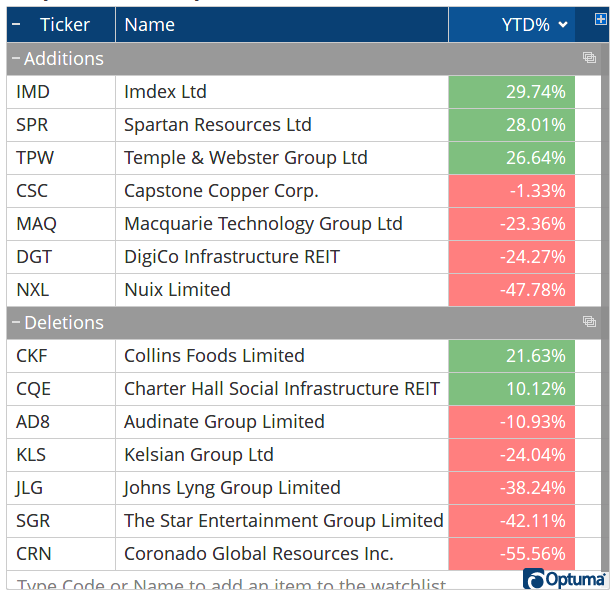 S&P/ASX200 Changes
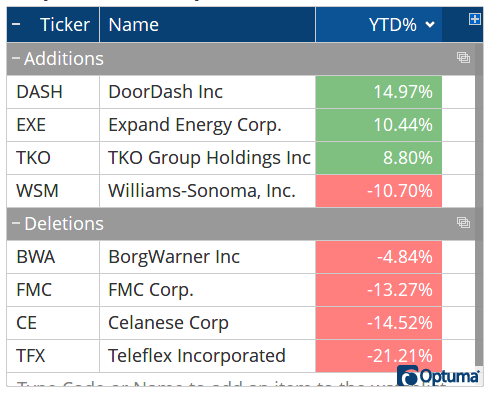 S&P500 Changes
Click the buttons below to save and open updated workbooks for the updated sector lists. The tabs in each workbook contain a list of the stocks in each sector, along with examples of charts, tools, and watchlists. Other examples include Seasonality charts, Relative and Historical Comparison charts.
The last tab shows a watchlist of all index members with a true/false column for those making new 6 month highs and another for 6 month lows (right-click on the column headings and select Edit Column to see the underlying script formulas). At time of writing there were 5 new highs and 8 new lows in the ASX200, with the chart on the right highlighting the new 6 month highs and lows with a Show Bar arrow, with the last 6 months highlighted in blue using a custom bar colour scheme:
 ASX200 6 Month Highs & Lows
Optuma clients can download the workbook files by clicking the buttons below, and once saved - usually to your Downloads folder - double-click on the file to open. When prompted, move them from the download location to your default Workbooks folder.
A number of sample workbooks with more chart examples can be downloaded from here.
You may have noticed that the exchange Sector and Industry groupings in Optuma's Security Selection window ...
Get blog updates and Optuma News

