Catching a Falling Knife
So far in this series, we’ve been looking at long term general market conditions with an overall bullish se...
In this second installment of the Andrews’ Pitchfork series Tim and Kyle walk through the ease at which Andrews’ Pitchfork analysis can be used in Optuma, and then proceed to share some examples of how this underutilized tool can be used in your trading.
| Read Part 1 | A Brief History of the Development of Median Line Analysis – A.K.A. Andrews’ Pitchfork |
| Read Part 3 | Andrews’ Pitchfork: Advanced Analytical Methods Using Median Line Analysis |
In the previous article, A Brief History of the Development of Median Line Analysis, we described the evolution of Andrews’ Pitchfork and those who had contributed to the technical tool that we know today. In this second article we’ll walk through the ease at which Andrews’ Pitchfork analysis can be used in Optuma, and then proceed to share some examples of how this underutilized tool can be used.
From the onset, you should be advised that the terminology we use is not necessarily the typical labeling used in identifying pivot points (if there is a standard). We chose to label the start of the median line at a reaction high or low as “PO”, or point of origin, and the next swing we label as “P1”, and the next as “P2”. The reason for this labeling method will come to light in the pages that follow.
Applying the Andrews’ pitchfork in Optuma to any price chart is as easy as four clicks. In the example below, we are applying a “low, high, higher low” pitchfork by selecting the tool from the “tools” tab and applying it to the chart with four left-clicks of the mouse. These four clicks are shown in blue with our labeling method in red:
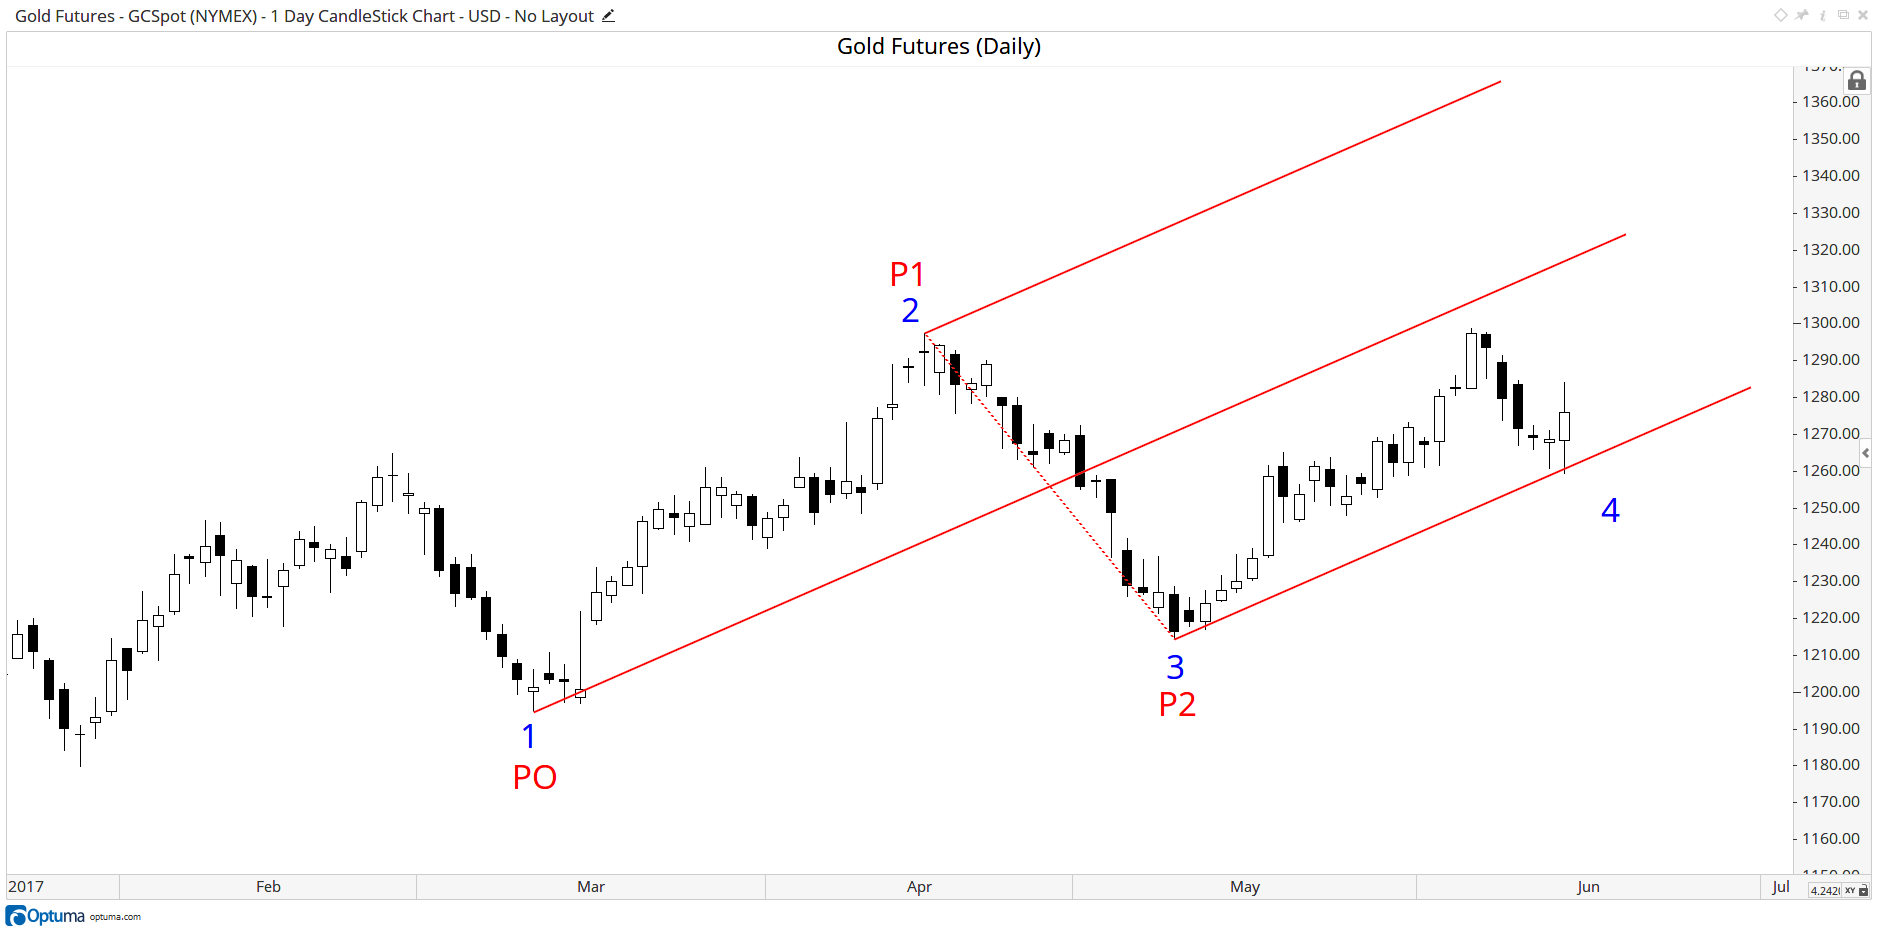 Andrews Pitchfork Points
In this second example we are applying a “high, low, lower high” pitchfork known as an Inverse Pitchfork:
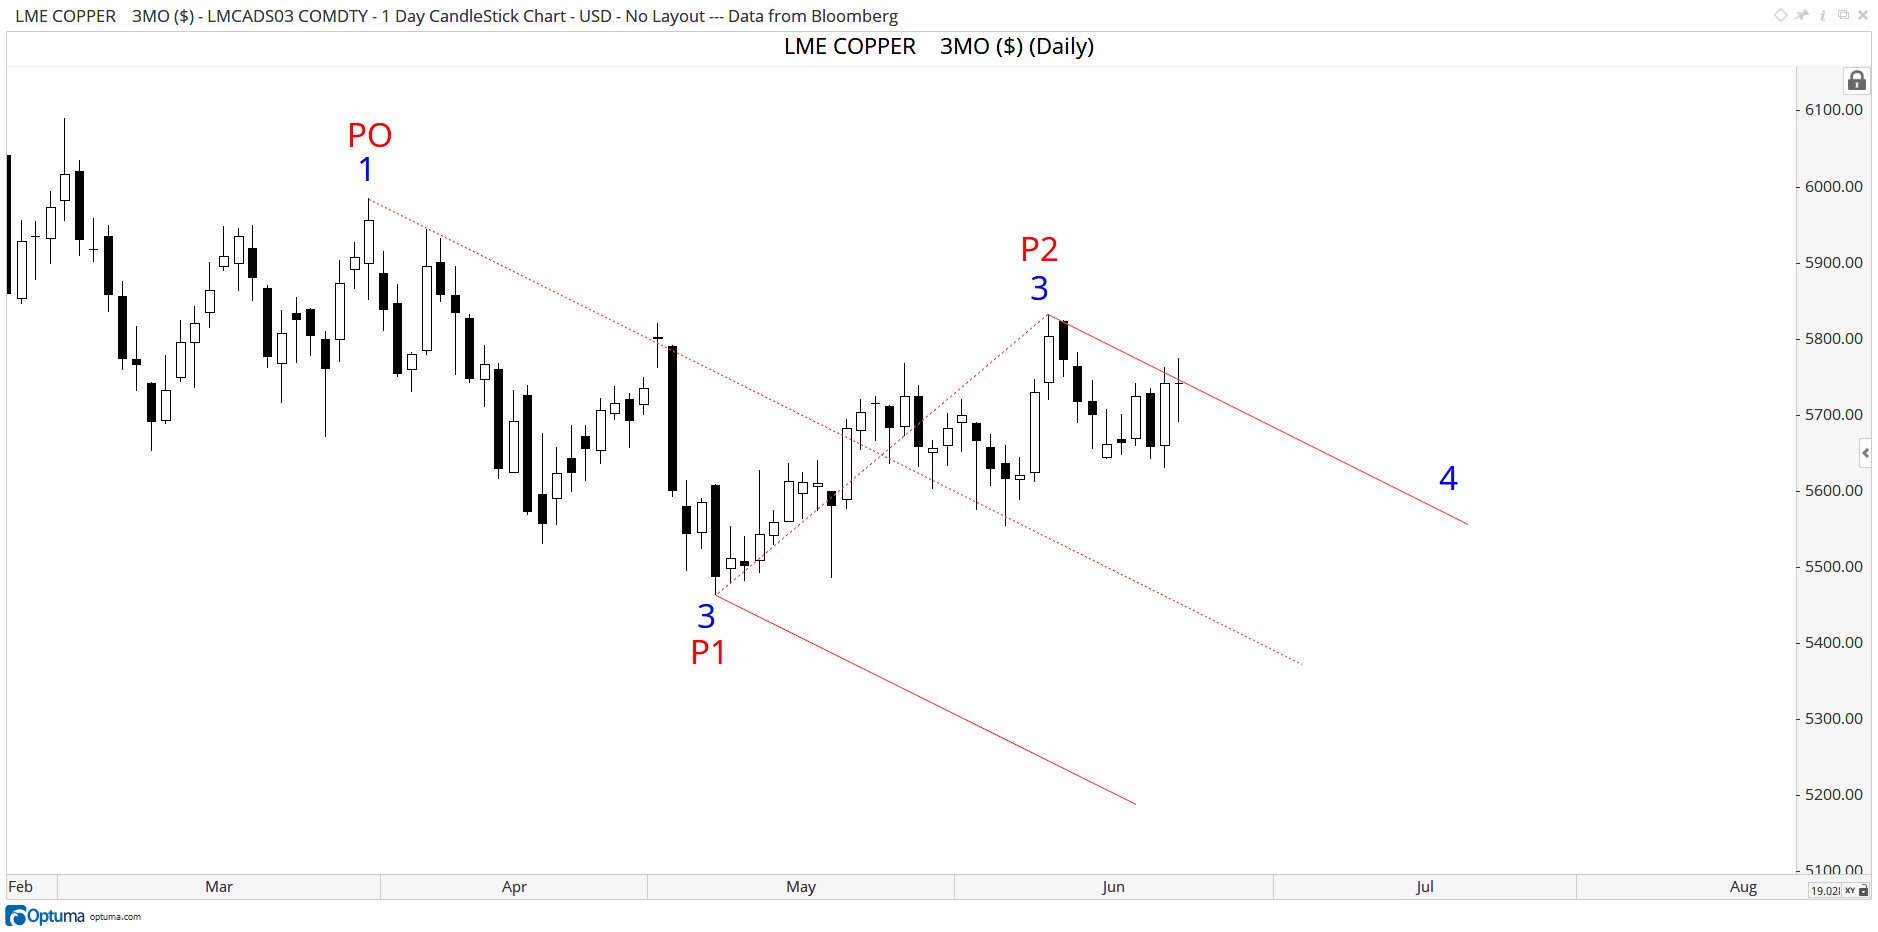 Andrews Inverse Pitchfork
In addition to the Standard Pitchfork that we applied above, it’s also possible to display Schiff and Schiff Modified settings. You may remember from Part One that Jerome Schiff was a student of Dr. Andrews who developed the Schiff-adjusted pitchfork, and Dr. Andrews took it one step further with Schiff Modified. These adjustments can be made by left-clicking on the pitchfork, then changing the Type in the tool’s Properties box, and selecting the different configurations. The charts below show the calculation and the change in the point of origination of the median line for the three configurations. Note how price in the yellow Schiff Pitchfork better respects the upper and lower parallels or “tines” of the Pitchfork. This configuration would be our analytical choice in this particular example. We will discuss this more, as well as our method and purpose of our “color coding” techniques, as we move forward. But first there are more technical tools imbedded in the Optuma Pitchfork tool to share with you:
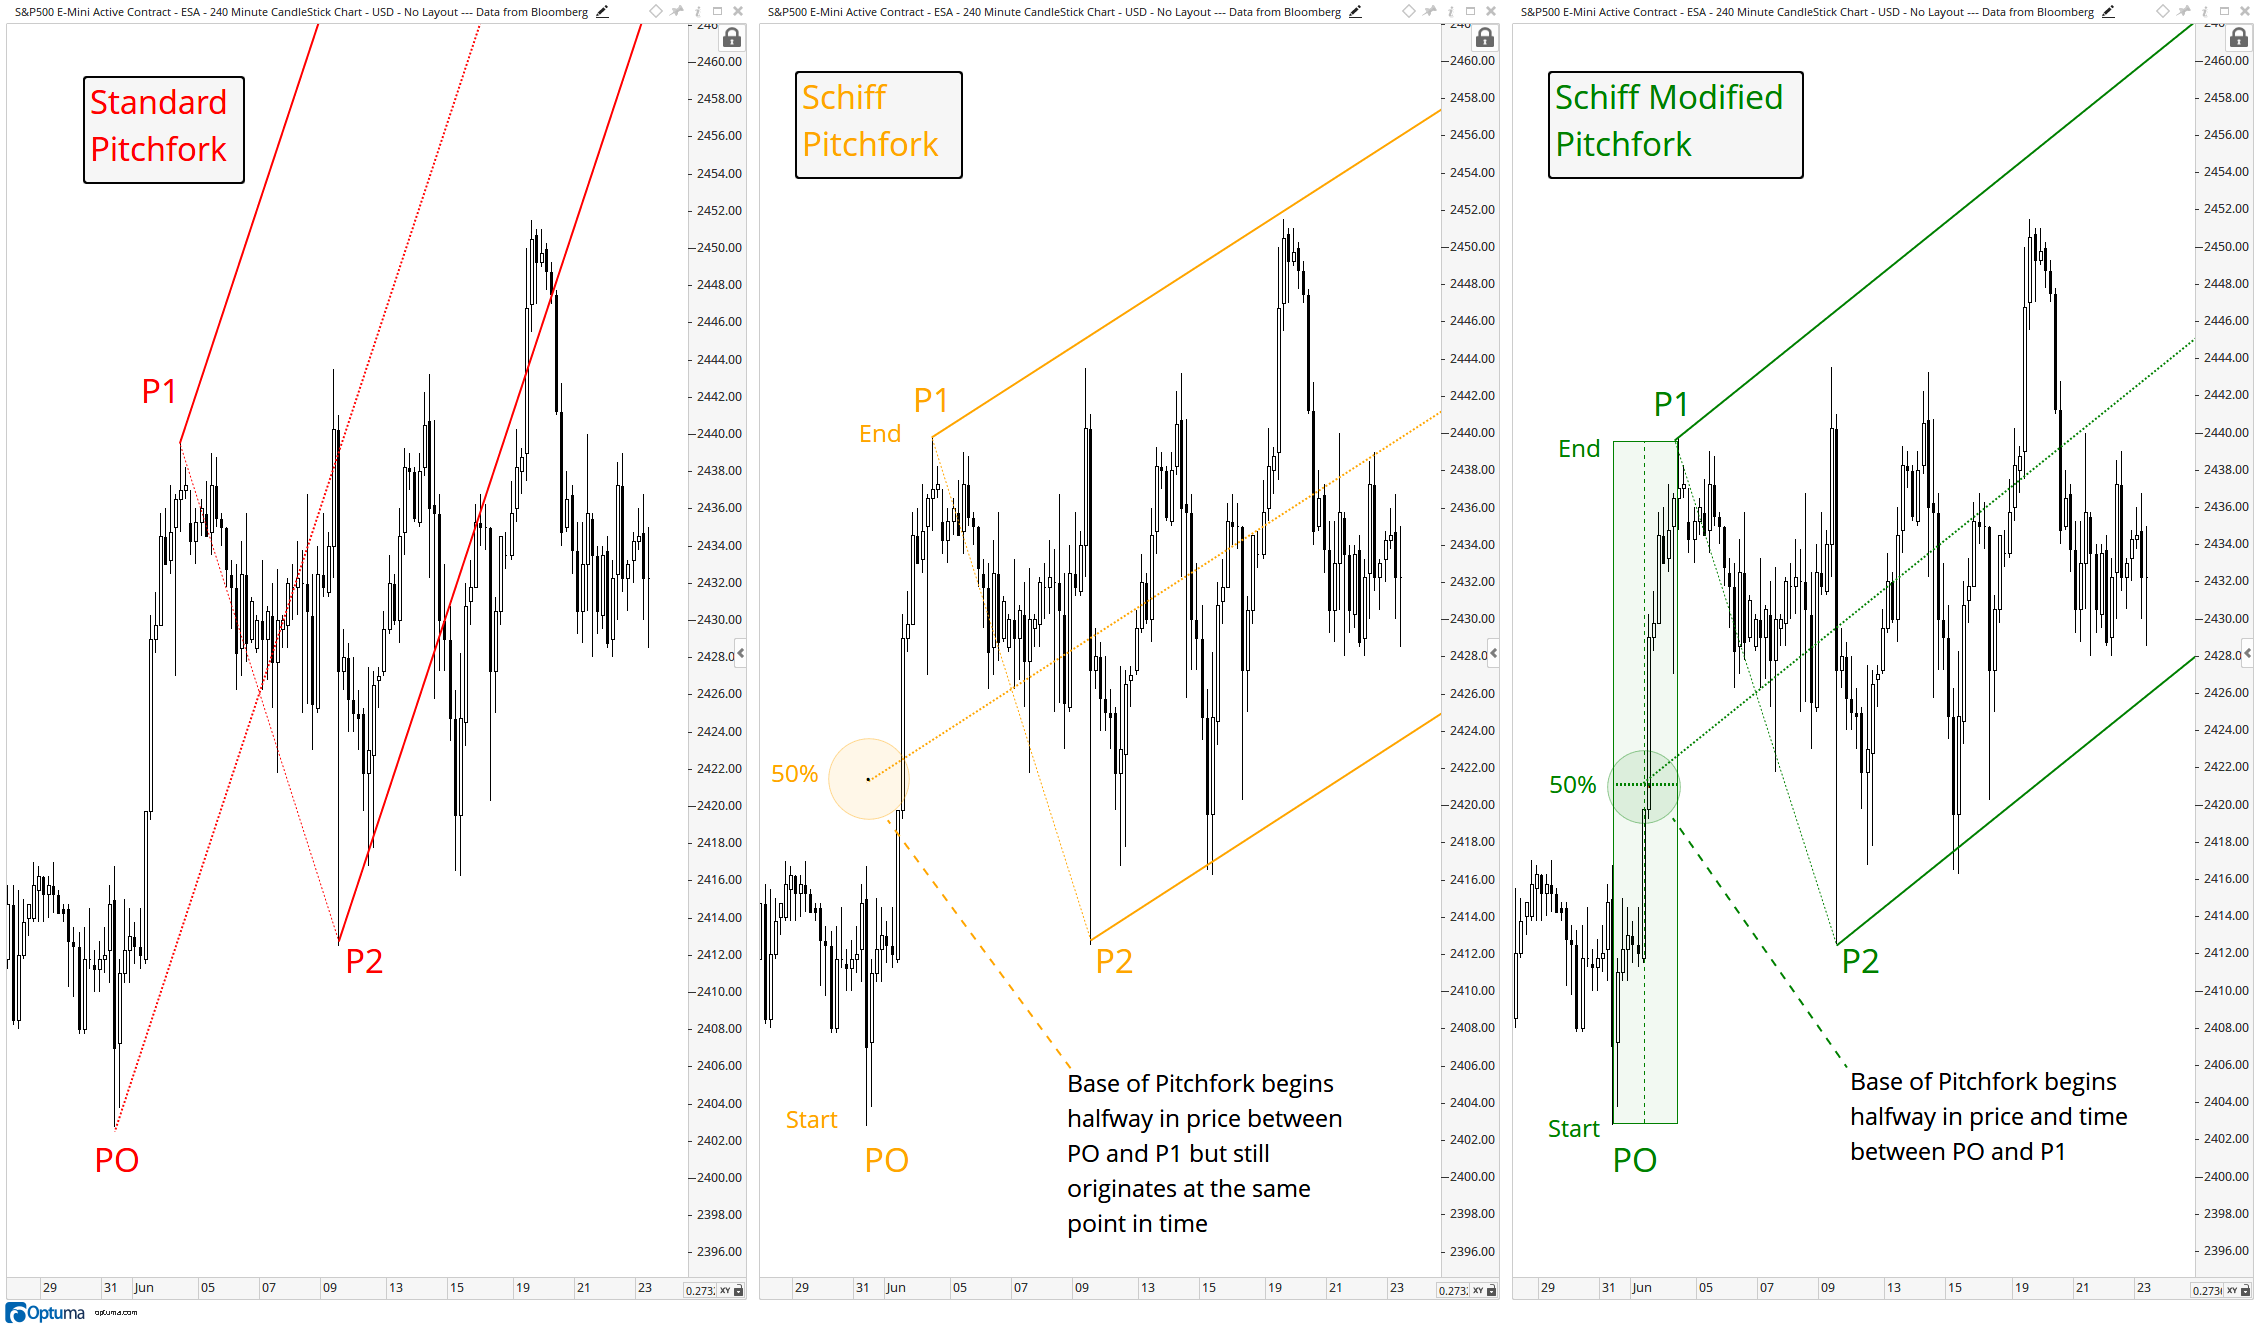 Schiff and Modified Schiff Pitchfork
After determining which pitchfork configuration is initially the most appropriate to use in starting a new analysis (Schiff Modified pitchfork on the chart below left), we look to confirm our choice by enabling the Extend Backward option in the Properties box. We can see when this tool is applied (chart below right), that even prior to the time that the pitchfork was drawn, price respected the angle, or “frequency”, of the trend by noting the price points marked with circles. This gives us a greater level of confidence that the Schiff Modified pitchfork represents the correct trend for this particular chart:
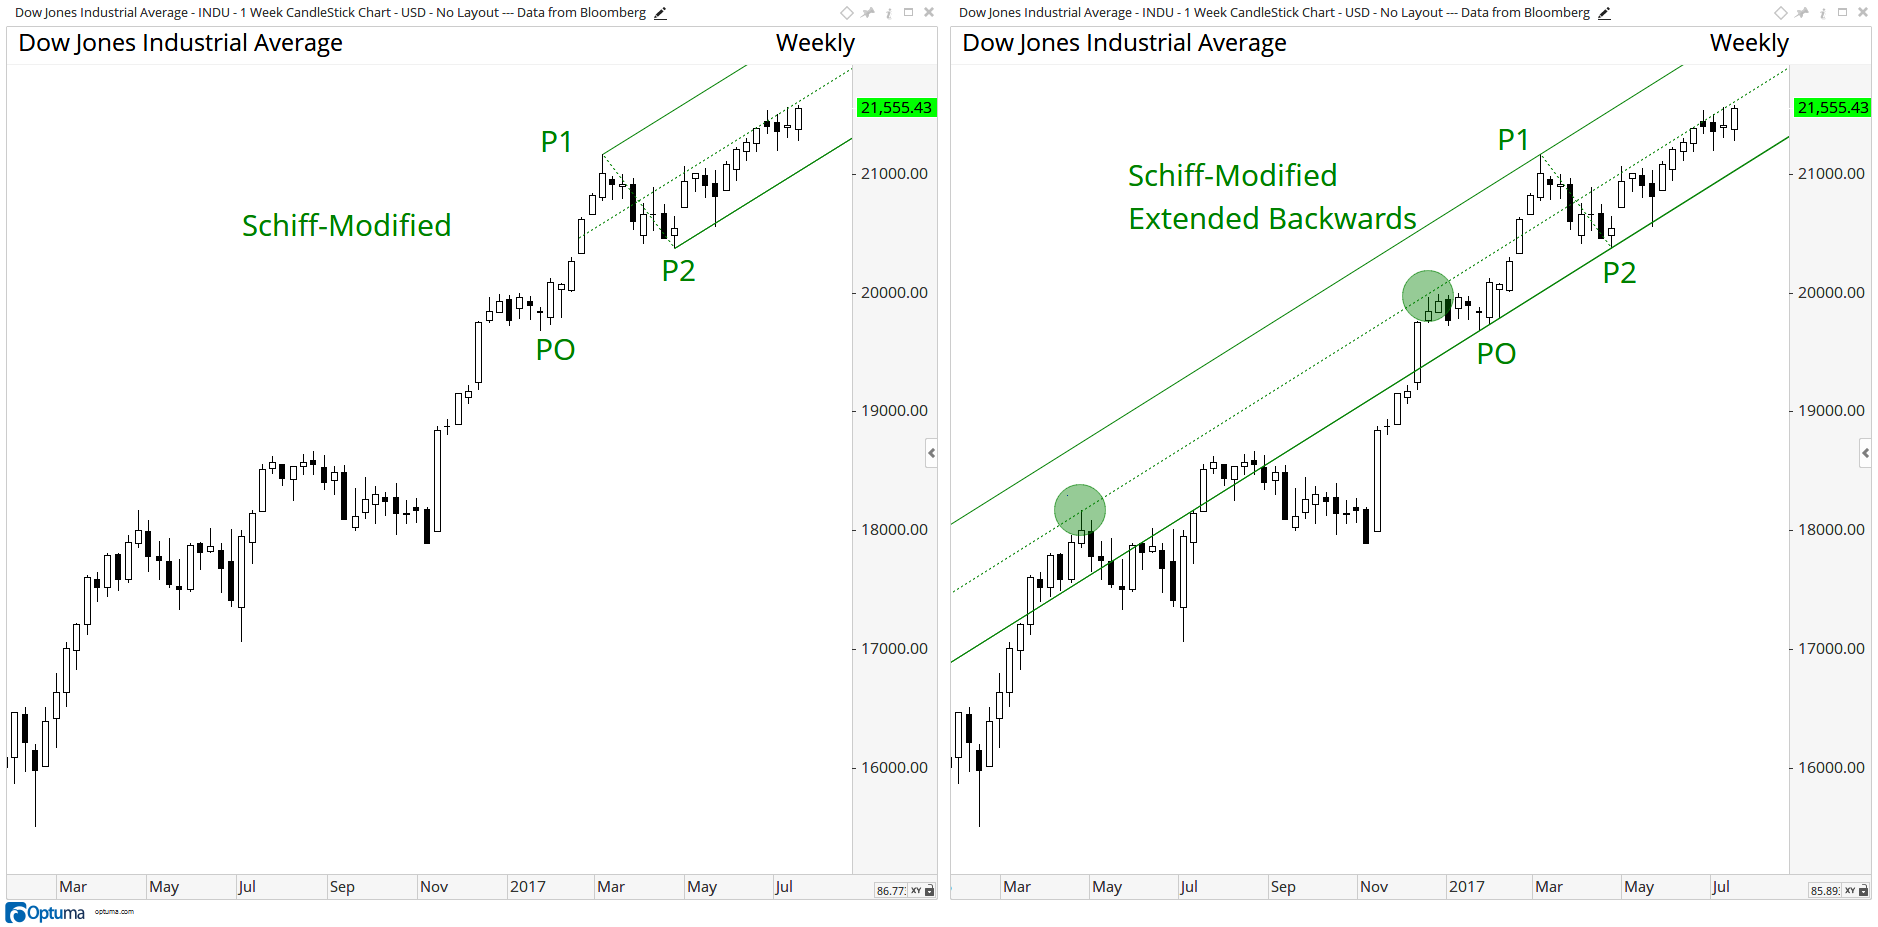 Extend Backwards Option
Warning Lines are parallel lines drawn outside the original pitchfork lines. They are drawn equidistant from the median lines and “tines” of the pitchfork. The number of warning lines, the direction (forwards, backwards, or both), line style (dashed in our example below), width, color, and transparency can all be applied and adjusted by clicking on the Warning Lines option in the Properties box:
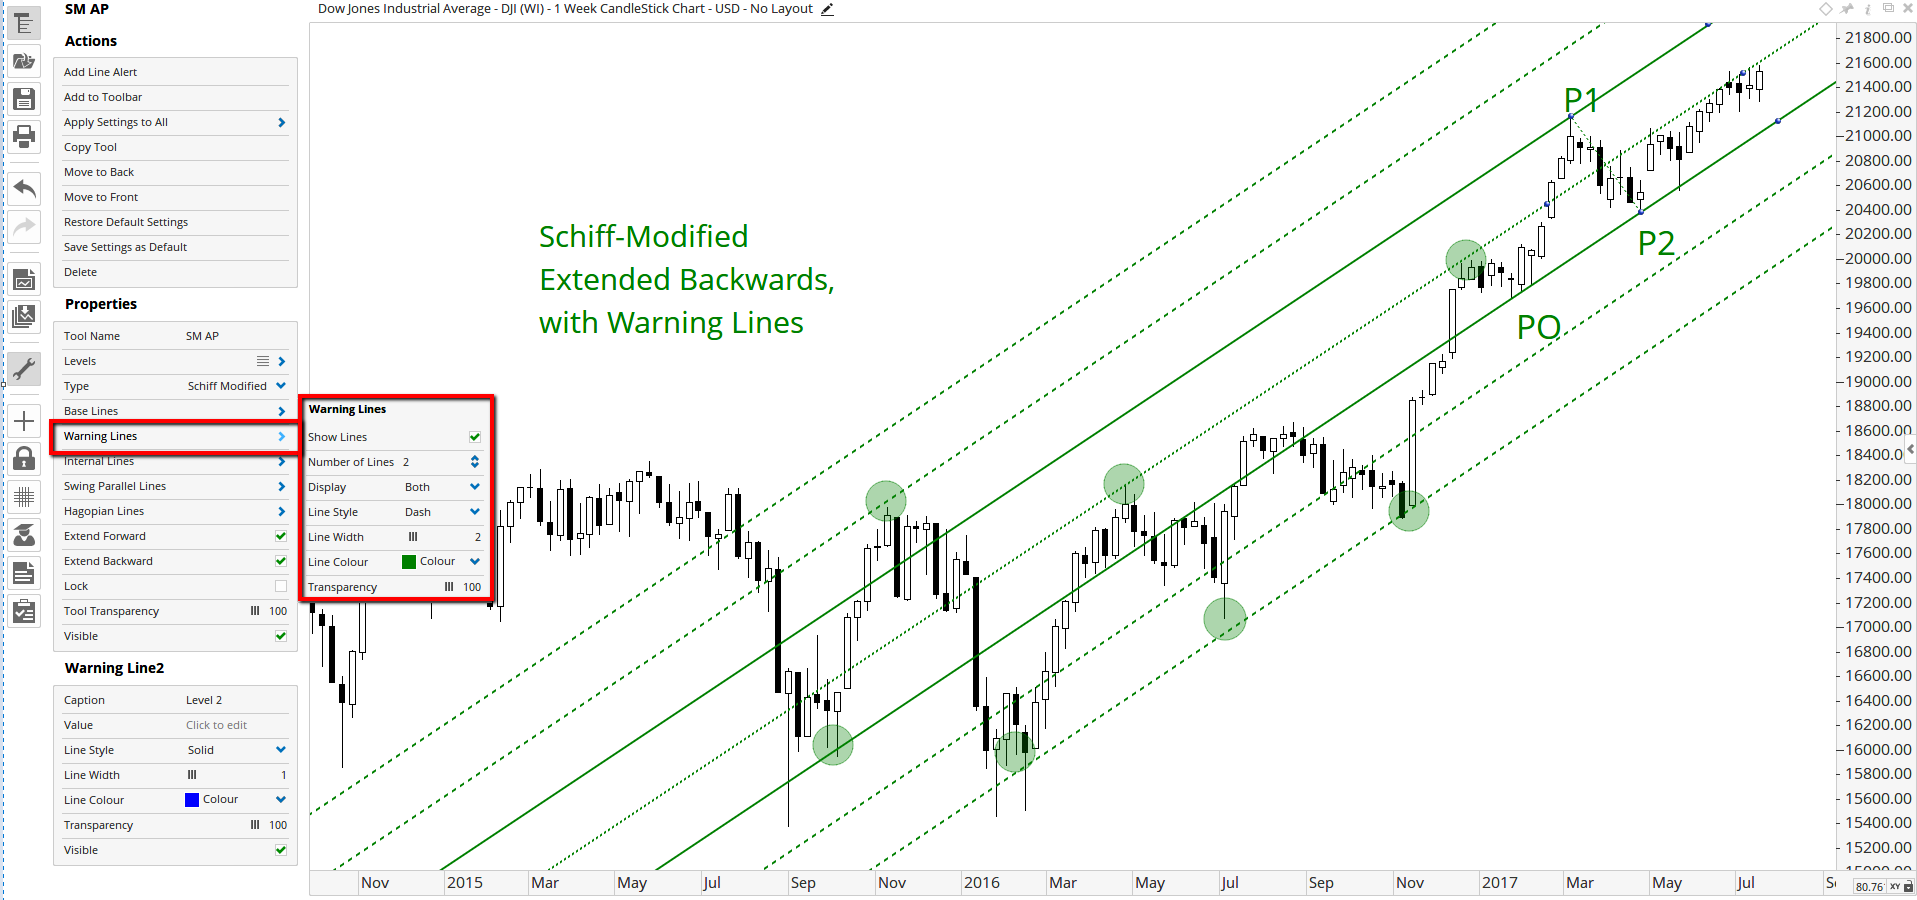 Warning Lines
Along with expanding the time frame to weekly, we applied to the above chart two upper and lower warning lines (green dashed lines) to our original example. There is little question now as to the validity of trend or frequency. It’s important to point out that in pitchfork analysis, minor violations on an intra-day or closing basis are not crucial to the spirit of the validity.
As an aside, we choose to color-code the three variations of pitchfork for the purpose of easy identification (red for Standard, yellow for Schiff, and green for Schiff Modified). This can be done by left-clicking on the parallel lines, median line, or swing line (between P1 and P2) of the pitchfork which will bring up an additional dialog box. The color, style, width, and level of transparency of the pitchfork lines can then be changed.
Along with warning lines, internal lines can also be drawn (another selection in the tool’s Properties box). Choose the percentage of the internal line required. As displayed in the Schiff Adjusted example below, a 50% setting will draw a line halfway between the upper and lower parallel and the median line. Line style, width, color, and transparency can all be adjusted. In our example below we have changed the color to red for clarity purposes:
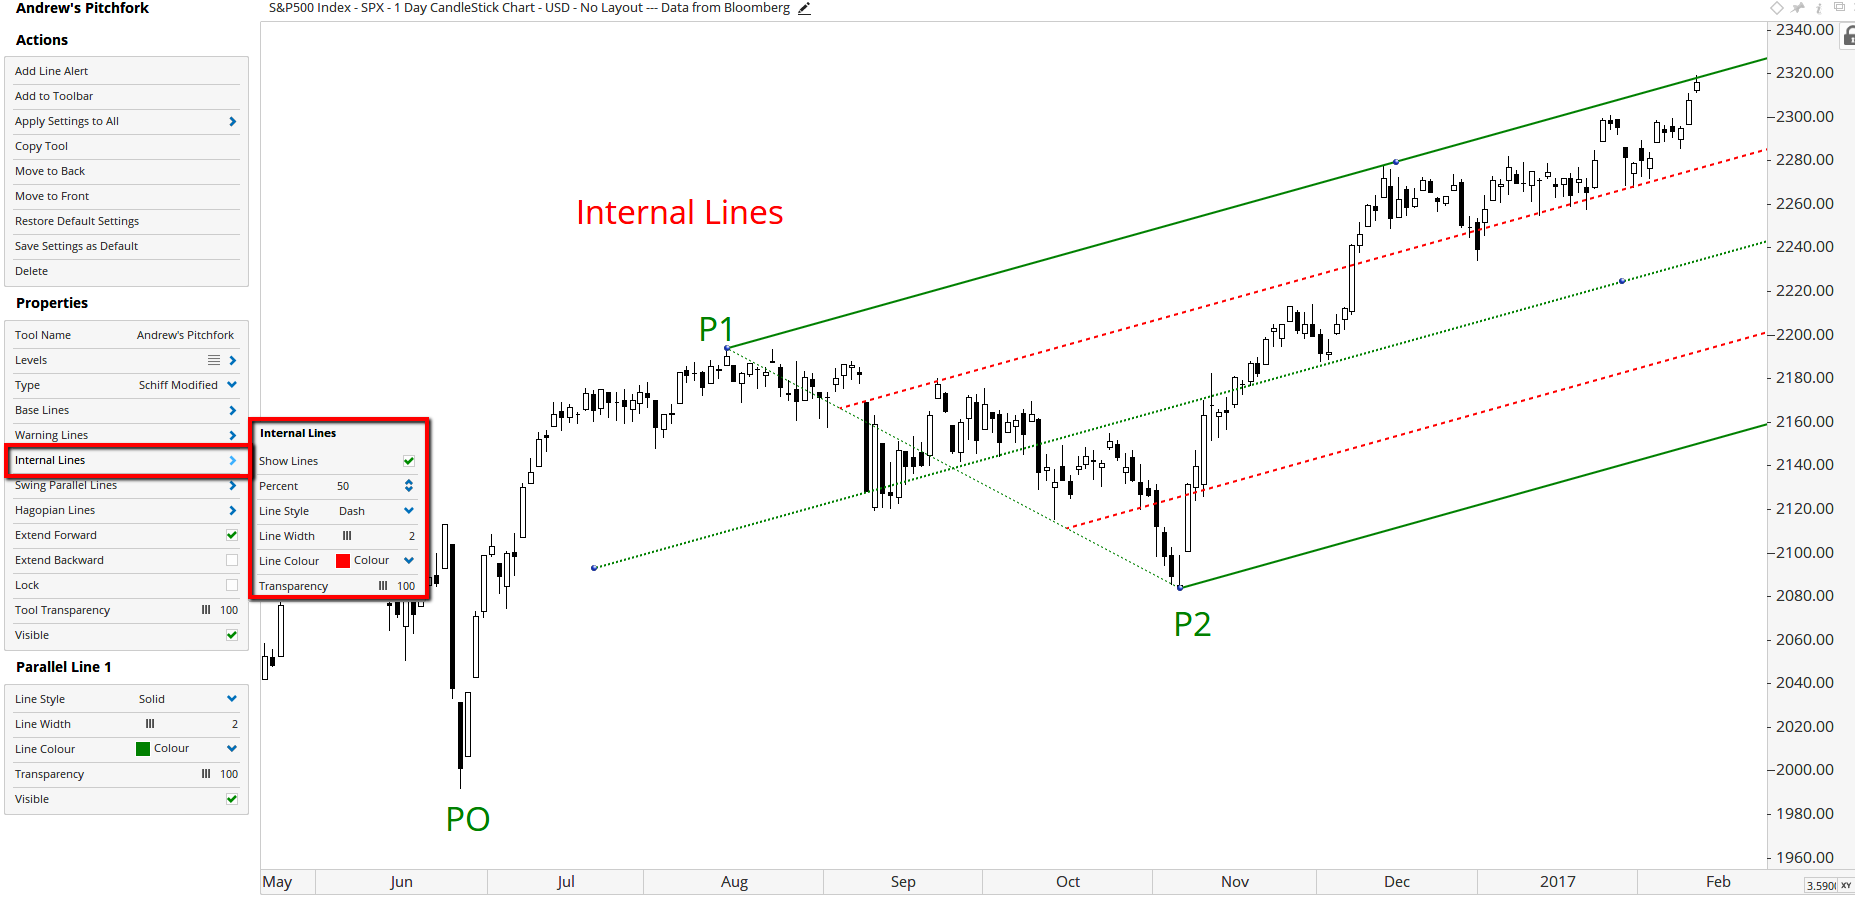 Internal Lines
Our next example focuses on an additional confirmation tool used in median line analysis. This technique was presented to Dr. Andrews by one of his course members - Mr. Hagopian. This option can also be found in the Properties box, Hagopian Lines. It draws lines connecting PO to P1, and PO to P2 (labelled H1 and H2 in blue below). To paraphrase Dr. Andrews, when prices fail to return to the median line (which studies have claimed to occur 80% of the time), a reversal may be on the horizon. In the chart below, price slowed at the 50% internal line, reversed, and broke above the upper parallel line. The reversal is confirmed by price trading though the upper Hagopian Line (H1), circled below.
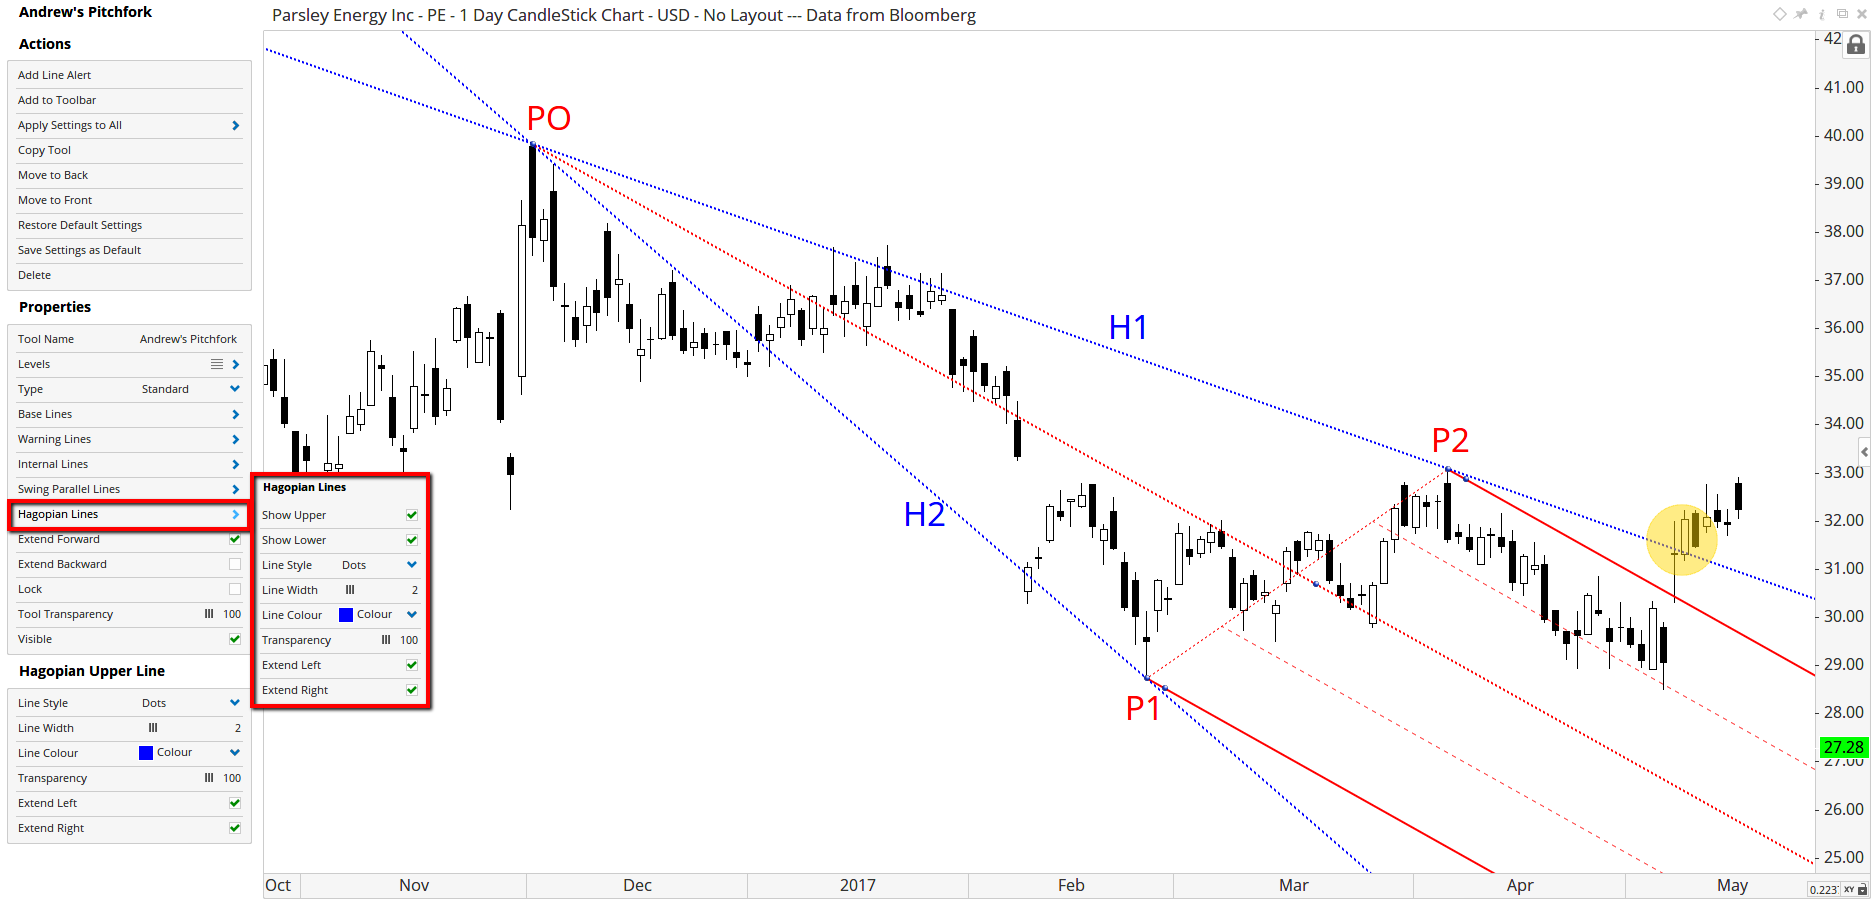 Hagopian Lines
Another Pitchfork option in Optuma is the Swing Parallel Lines. Selecting these lines in the properties will draw lines across the pitchfork parallel to the base or swing line (in the example P1 to P2). The distance between these swing lines will be the same as the length of the pitchfork handle (PO to PO2, highlighted in orange). These swing parallels, SP1 and SP2, further identify points of support and resistance on the price grid.
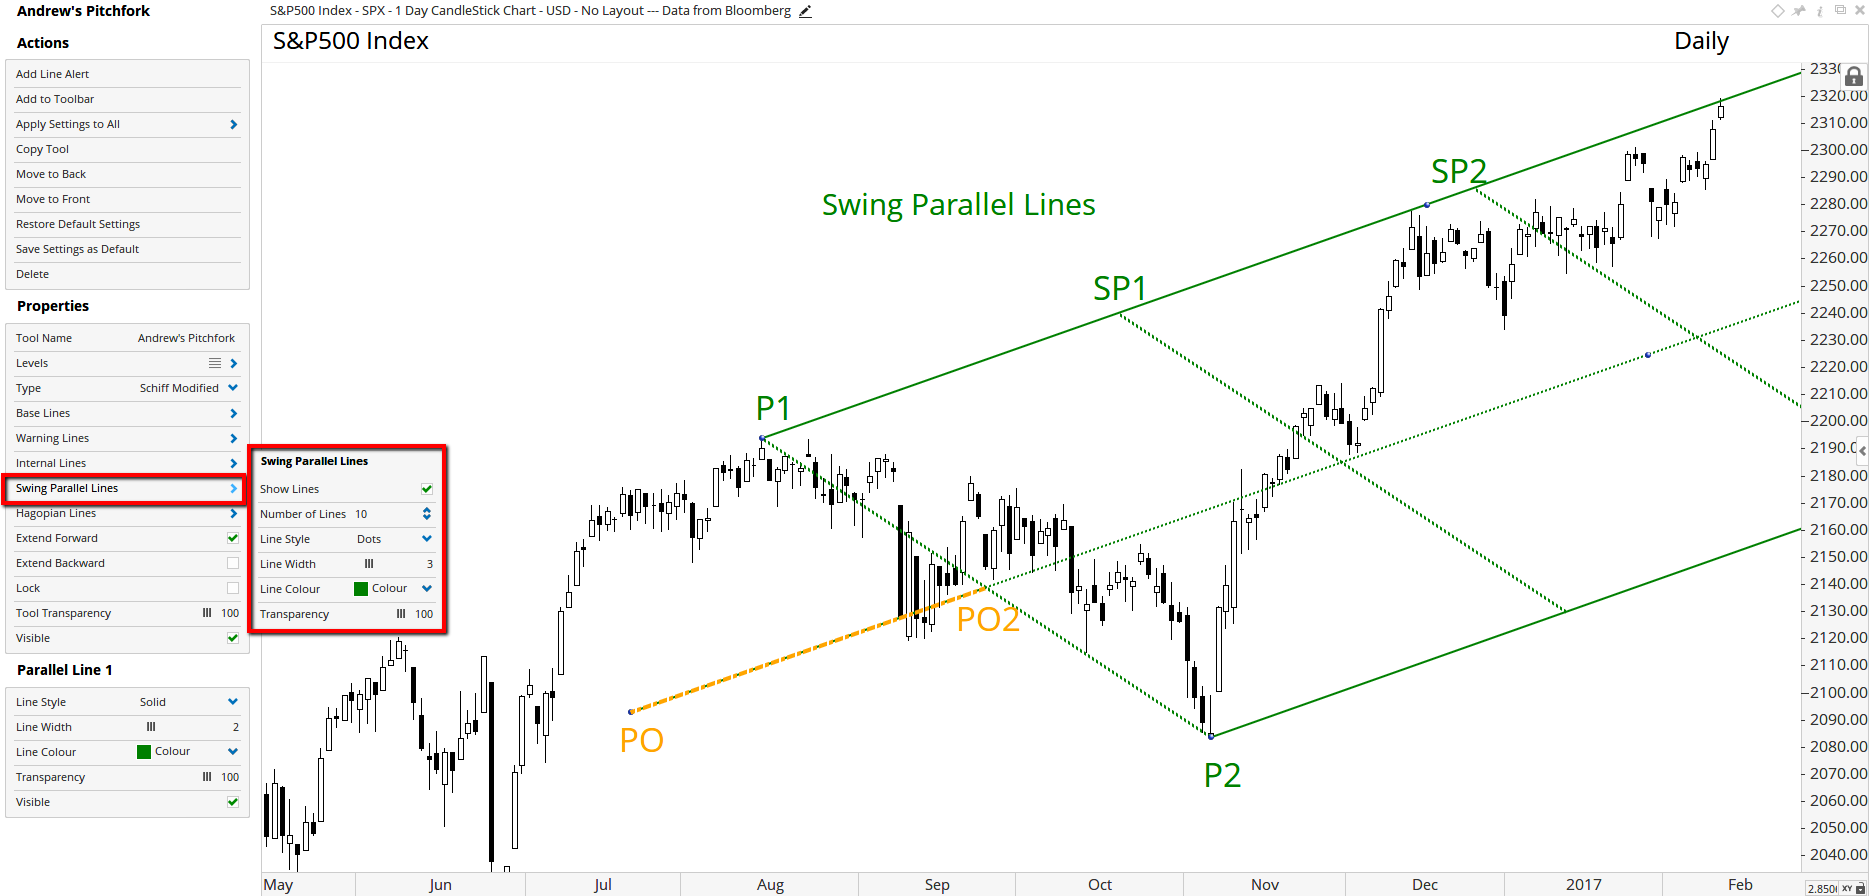 Swing Parallel Lines
Sliding Parallels (SP on the example below) are lines drawn parallel to the median line. They can be drawn between the upper and lower parallels or outside the confines of the pitchfork. They always share the same angle, and represent internal and external support and resistance. In the example below, the sliding parallel is drawn by right-click on the pitchfork, then left-hover the arrow over the running man and left-click “copy tool”. Then move the pencil to PO (point of origin) of the sliding parallel. This will draw a new pitchfork of which you can reduce the transparency of the upper and lower parallel and swing line to zero, leaving only the sliding parallel, which in this case we have changed to blue. On close inspection readers will notice that the sliding parallel (SP) is very close to a 50% internal line.
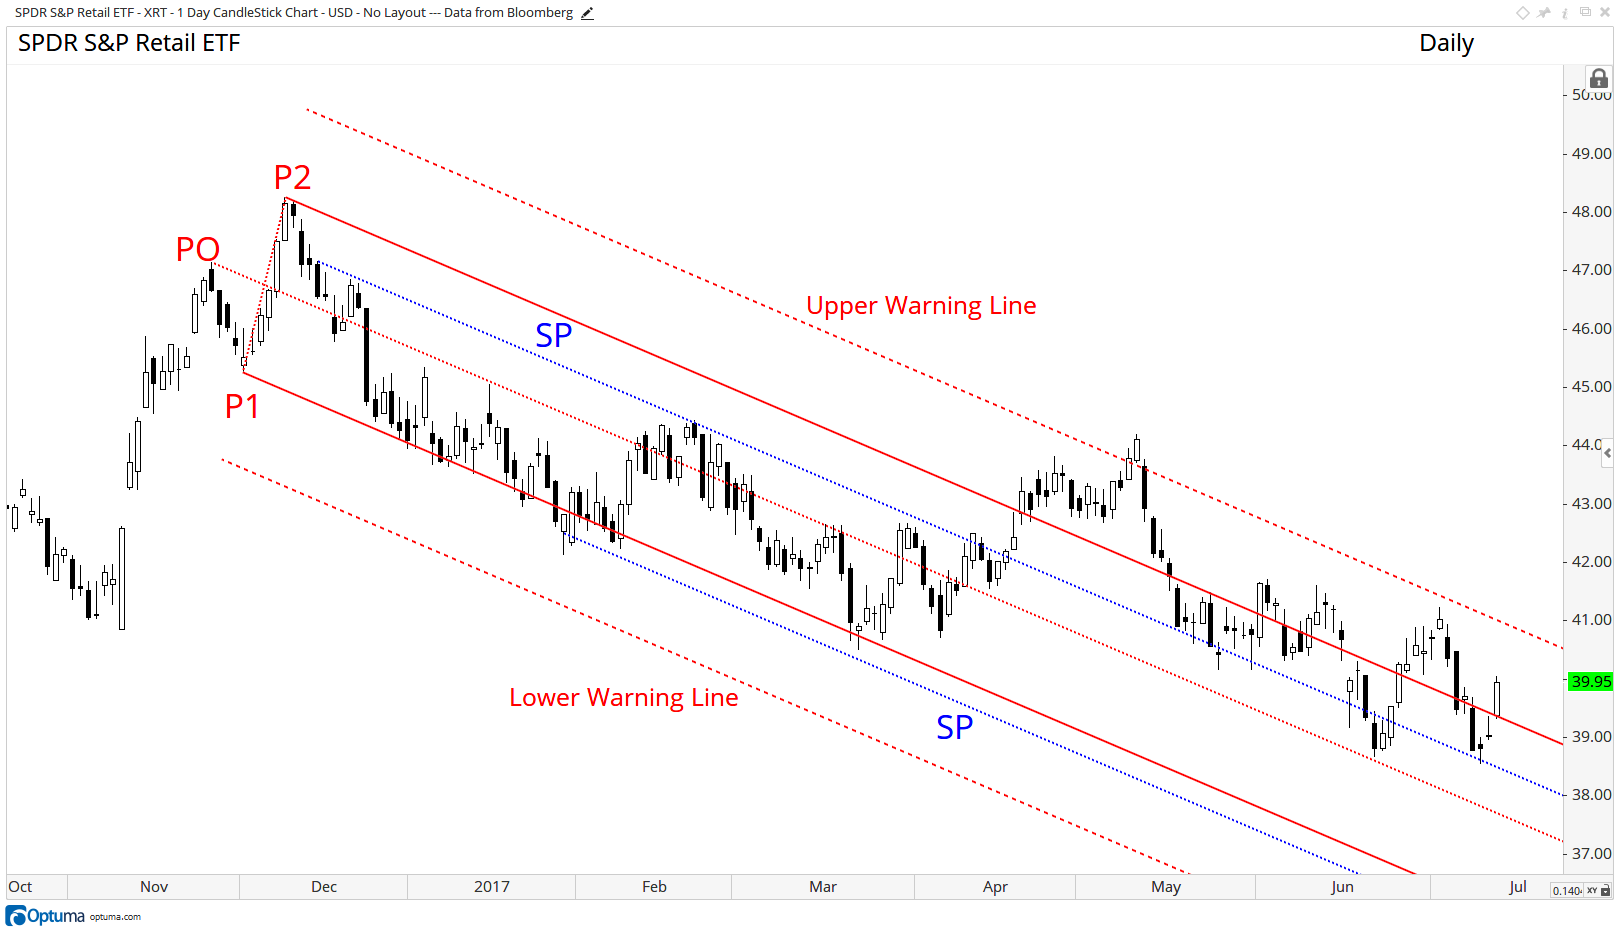 Sliding Parallels
In the third and final article, we will share further pitchfork methods. These include what we have coined as “Combination Pitchforks” and “Dueling Pitchforks”. When combined, these techniques create a support and resistance frequency grid in price and time (one of which we show below). We will also demonstrate pitchforks used in concert with multiple time frame momentum analysis.
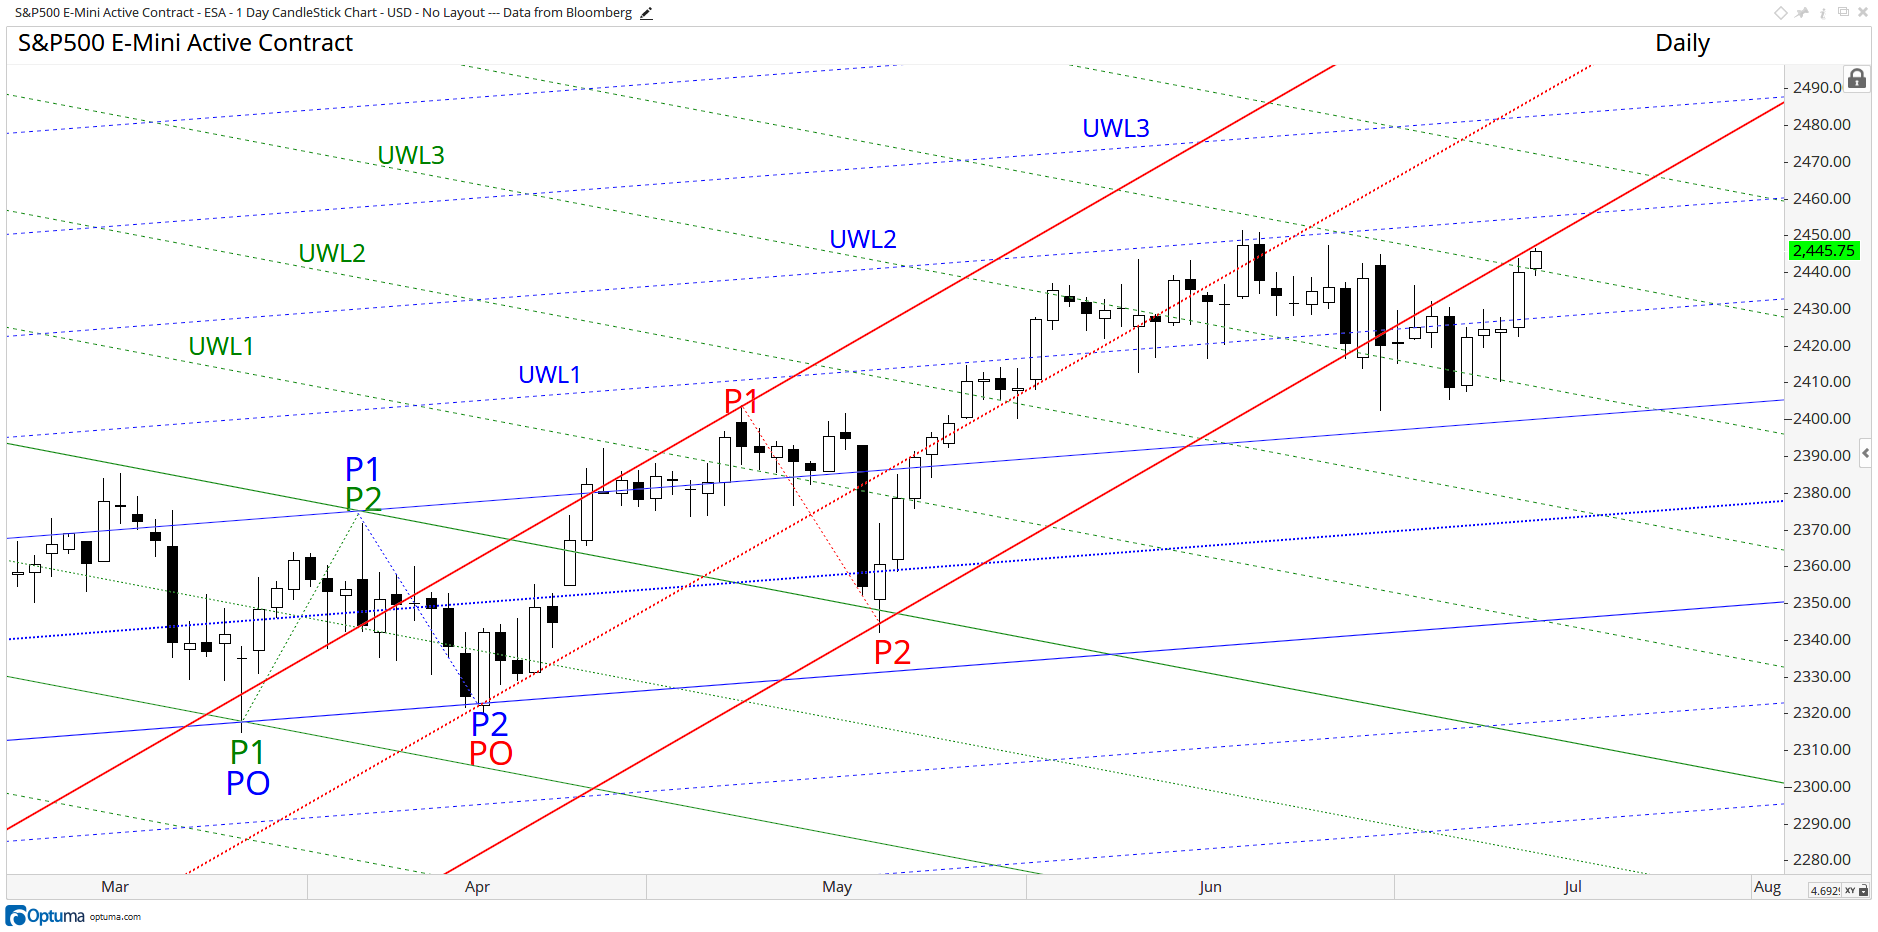 Combination Pitchforks
Get blog updates and Optuma News
