Catching a Falling Knife
So far in this series, we’ve been looking at long term general market conditions with an overall bullish se...
As you may know, Optuma has several tools to help identify significant turning points, such as the various swing overlays, but one tool I’ve started to use more and more is the Pivot Label tool.
Note: This article first appeared in 2020 but has been updated to reflect subsequent changes that have been made in the PIVOT() function to account for unconfirmed pivots. As such, if you have existing scans or formulas from the previous article they should be amended, as per the examples below.
Darren Hawkins
This version also includes sample workbooks that clients can download and open in their copy of Optuma.
As you may know, Optuma has several tools to help identify significant turning points, such as the various swing overlays, but one tool I’ve started to use more and more is the Pivot Label tool.
You can read more about the tool here, but basically it labels high and low turns based on the number of bars either side, so the higher the number the more significant the turn. In the example for the S&P500 below, the Pivot Labels on the left have been set to 10, which means that there must be at least 10 bars both before and after the high/low for a label to appear (in this case I used daily bars, but they work the same in any timeframe). Compare that to the 20 bar pivot on the right which will obviously show fewer - but more significant - turns as the interval required either side is higher.
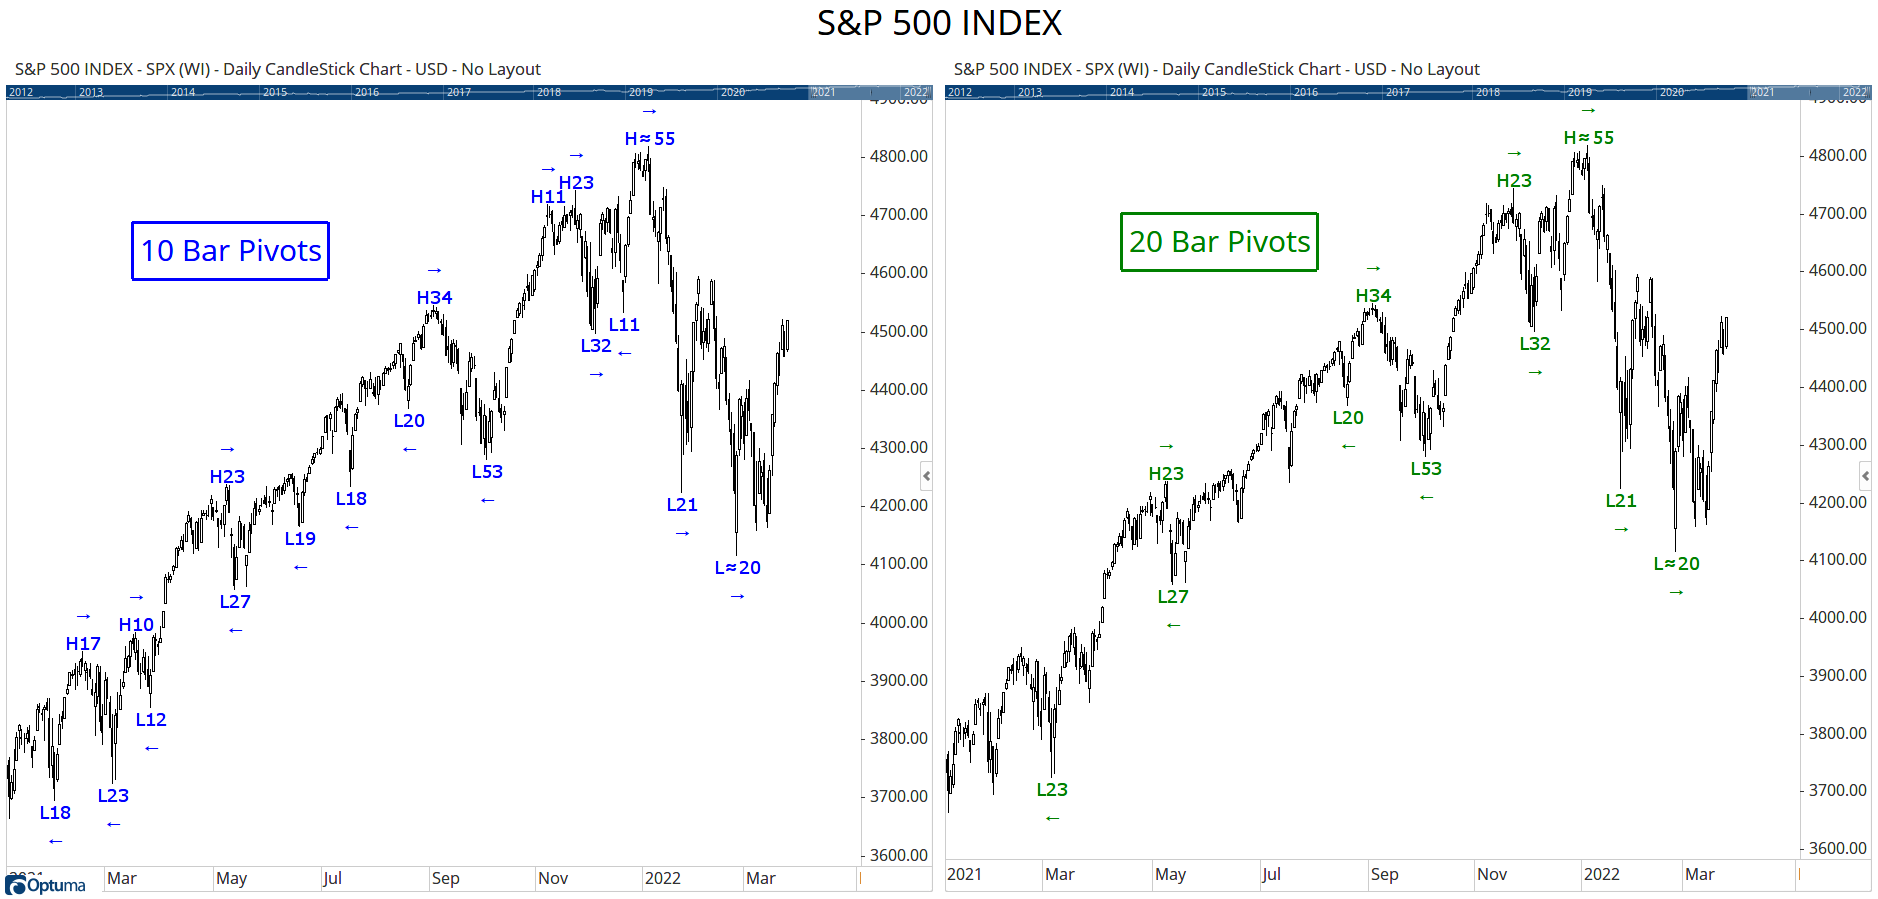 SPX Pivots
Note: you can change the chart (or scan) timeframe to weekly to make the turns more significant.
This article will show you how to create a scan to identify breakouts from previous pivot levels and save those results as a watchlist in a workbook, so that every time the workbook is opened the scan will be automatically executed and the list updated - a great timesaver!
If we know the last pivot value then we can create a scan to alert us when that level has been breached, thus signifying a potential breakout that might be a great trading opportunity. In the scripting language we can use the PIVOT() function to calculate these levels.
In the script editor window add the PIVOT() function and click on the text to select your parameters, eg 15 bar pivots based on highs.
NOTE: You should also ensure that the Ignore Unconfirmed option is ticked to prevent the results changing as new data is added to the chart.
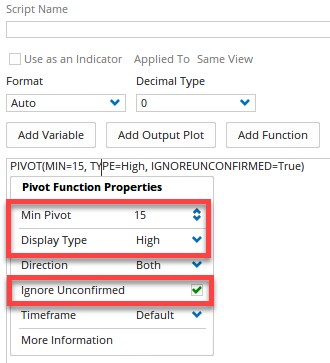 PivotScript
This script on its own will simply return true when the current bar is the highest bar for at least 15 bars. To get the actual value at that point, we need to use the VALUEWHEN() function, ie the value when the pivot condition was true. By default the VALUEWHEN() function calculates the closing price of the trigger day, so we’ll need to nest HIGH() in the parentheses to get the high price on the day of the confirmed pivot. The complete formula will be as follows (remember the lines beginning // are comments):
1
2
3
4
5
// Define the pivot criteria
V1=PIVOT(MIN=15, TYPE=High, IGNOREUNCONFIRMED=True);
// Get the high price for the V1 pivot
V2=VALUEWHEN(HIGH(), V1);
V2
In this example of $AAPL, the last 15 bar high pivot was at $176.65, as shown in the watchlist and plotted on the chart using the same formula above in a Show Plot tool.
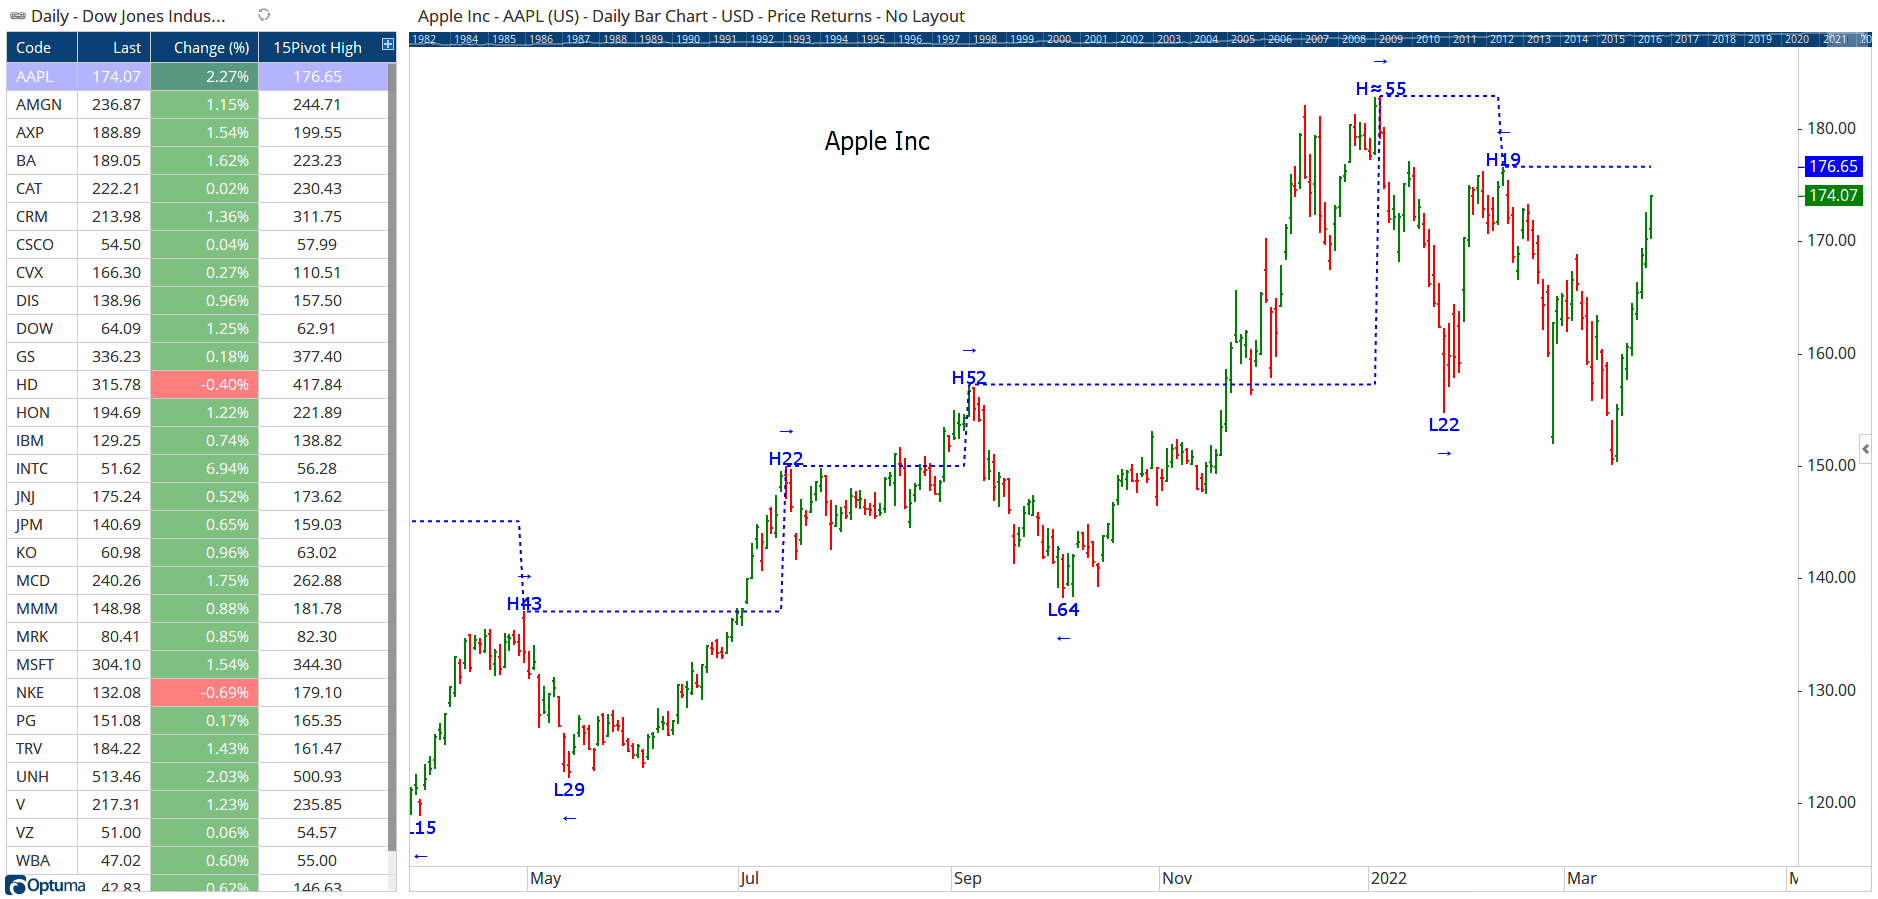 Pivot High Values
So now we have the previous pivot value we can compare it to the current price, and set a true/false signal if that level has been taken out using CrossesAbove in the formula:
1
2
3
4
5
6
// Define the pivot criteria;
V1=PIVOT(MIN=15, TYPE=High, IGNOREUNCONFIRMED=True);
// Get the high price for the V1 pivot;
V2=VALUEWHEN(HIGH(), V1);
// Define signal
CLOSE() CrossesAbove V2
Here’s an example of an ASX300 scan showing 8 breakouts, including $JBH closing above February’s 26 bar high of $54.32 on strong volume:
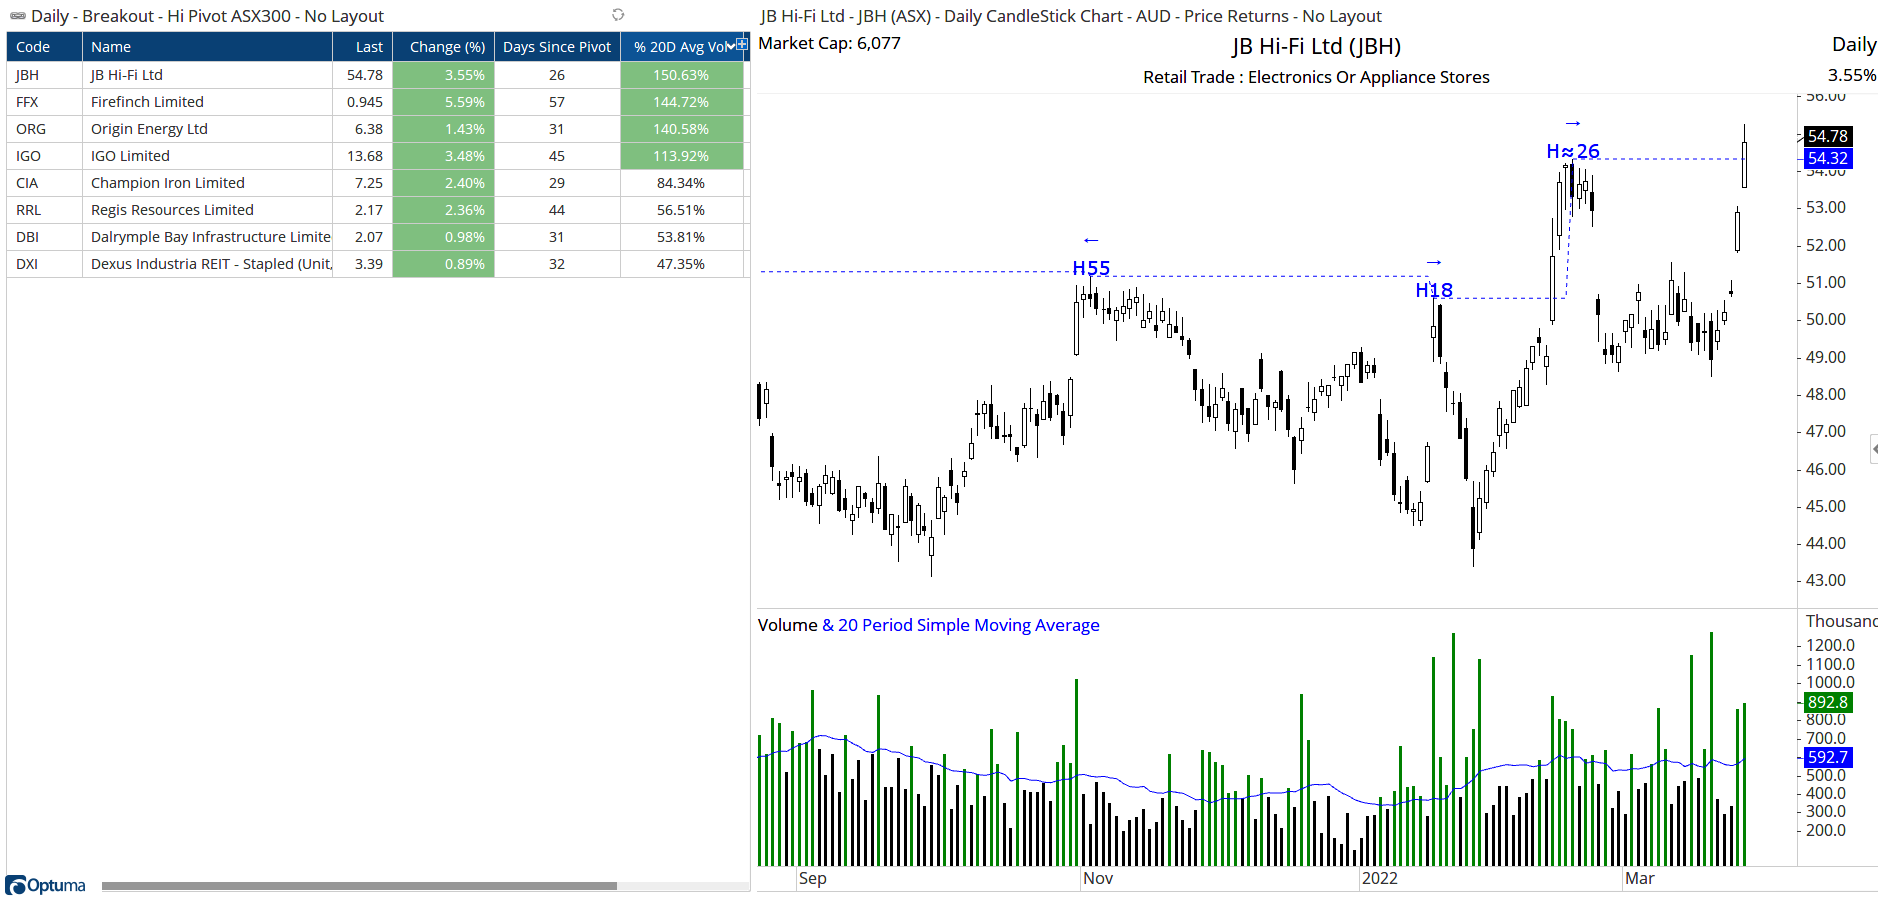 Scan Results
The Days Since Pivot watchlist column formula tells you how long the pivot level has been in place using the TimeSinceSignal function (ie 26 days for $JBH, and 57 for $FFX):
1
2
V1=PIVOT(MIN=15, TYPE=High, IGNOREUNCONFIRMED=True);
TIMESINCESIGNAL(V1)
The watchlist also has a % of 20D Avg Vol column to show the if there was strong volume associated with the breakout. In the case of $JBH the day’s volume was 50% higher than average, whereas $DXI had less than half.
1
VOL() / MA(VOL(), BARS=20, CALC=Close)
To scan for breaking support the concept is exactly the same but with slightly different syntax for a pivot low because the price action is going in the opposite direction, ie CrossesBelow:
1
2
3
4
5
// Define the pivot criteria
V1=PIVOT(MIN=15, TYPE=Low, IGNOREUNCONFIRMED=True);
// Get the low price when the last V1 pivot occurred
V2=VALUEWHEN(LOW(),V1);
CLOSE() CrossesBelow V2
A great timesaver is to open scan results as a watchlist or previously saved Page Layout, and then saving that in a workbook. From the Scan Results window click Export Results > Open Results As:
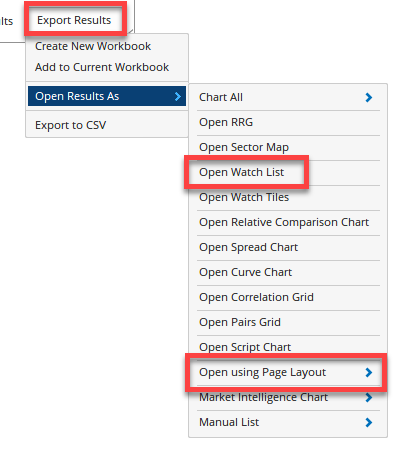 Open Results As
Because the watchlist is linked to the scan, when you open the workbook tomorrow (once the end-of-day data has been downloaded) the list will automatically update with the new breakouts.
This means you can have a workbook containing a series of page tabs linked to scans, so as you click on the tab the stocks with a true result will populate the watchlist.
Optuma clients with access to Australian or US data can click the buttons below to save and open weekly watchlists showing 10 bar breakouts in true/false columns.
Enterprise Services clients can set up command line prompts in the Windows Task Scheduler, which will automatically run the scans at a time of your choosing. The results will be automatically exported as either images, a PDF, a .csv list of symbols, or even an email (Microsoft Outlook clients only) using your preferred page layouts. You can watch a video on building command lines here.
If you have any questions or need more help with creating custom scans or formulas please post on the scripting forum. Make sure you search the forum first to see if your question has already been answered, but if you need more advanced help then one-on-one consulting sessions are also available.
Get blog updates and Optuma News
