ASX and S&P500 Sector Workbooks
This week saw the quarterly rebalancing in the ASX200 and S&P500 indices. Optuma clients can download and o...
In this article, Alex explains the concept of momentum used in the GoNoGo Oscillator.
To answer this question in the context of technical analysis I would say that it is the acceleration of price movement. Momentum can help the trader understand the velocity of price change and get a sense of the strength of price trends. It can give clues as to whether price will continue in the current direction or if the trend is at risk of stalling.
When I teach the concept of momentum to new technicians, I talk cars. Being from the UK, I grew up in a strong car culture. Formula One, and the World Rally Championship were events that had me glued to the TV. Using a car’s acceleration as a proxy for price momentum resonates with students and brings an understanding of the value in studying these technical indicators.
Imagine driving a car accelerating on a ramp to join a highway. As you increase speed to join the highway the car will increase its speed quickly. You may go from 10-20 mph, 20-30 mph, and 30-40 mph and each increase of pace might take a similar amount of time. In each of these speed increases, the rate of change of speed is the same. As you approach the highway speed limit, which here in New Jersey is 50mph, you will continue to get faster but most likely at a slower rate. You might go from 40-45 mph, 45-48 mph, and 48-50 mph. At 50 mph, unless you are willing to risk the long arm of the law you are going to stop accelerating. As you got close to top speed, you were still getting faster, but you were getting faster more slowly! The car’s decreasing rate of acceleration (falling momentum) tipped us off to the fact that we were approaching the highest speed we could go. Our next move is likely to slow down when we approach our exit.
So it is with price momentum. With each price increase, we would like to see that price increase with the same velocity, the same momentum. If price is making higher highs, we would expect similar or higher highs in momentum in a strong trend. If price is making higher highs, but momentum is less on each high (making lower highs) then it suggests that we may be approaching top speed! There is a chance that we will not see new highs, and even the chance that price may fall.
Momentum indicators are an attempt to measure the speed at which price has arrived at its current level. They will involve a look back period to compare current price in some way to prior prices. Below are just a few of many.
One of the simplest ways to get a sense of the speed of price change is to use the Rate of Change indicator. This study compares price to price N bars ago and then divides by price N bars ago. In this way it makes the change a percentage and so gives a reading that can be compared across securities.
 Optuma SPY ROC
The CCI is another well used momentum indicator. Whereas ROC compared price to a single price a set number of periods ago, CCI looks at price and compares it to an average of its prices over a set time frame. In layman’s terms it compares price to an historical average of price, and then divides by a standard deviation of price (the price used is the “typical price” or (H + L + C) / 3).
 Optuma SPY CCI
Perhaps the most used momentum indicator in our industry, RSI has a different calculation. This momentum study looks back over a set number of periods and evaluates whether the bar closed up or down. It then divides the number of higher closes by lower closes and converts this idea into an oscillator that moves between 0 – 100. This concept has value because one would expect that as prices move higher there will be more higher closes relative to lower closes.
 Optuma SPY RSI
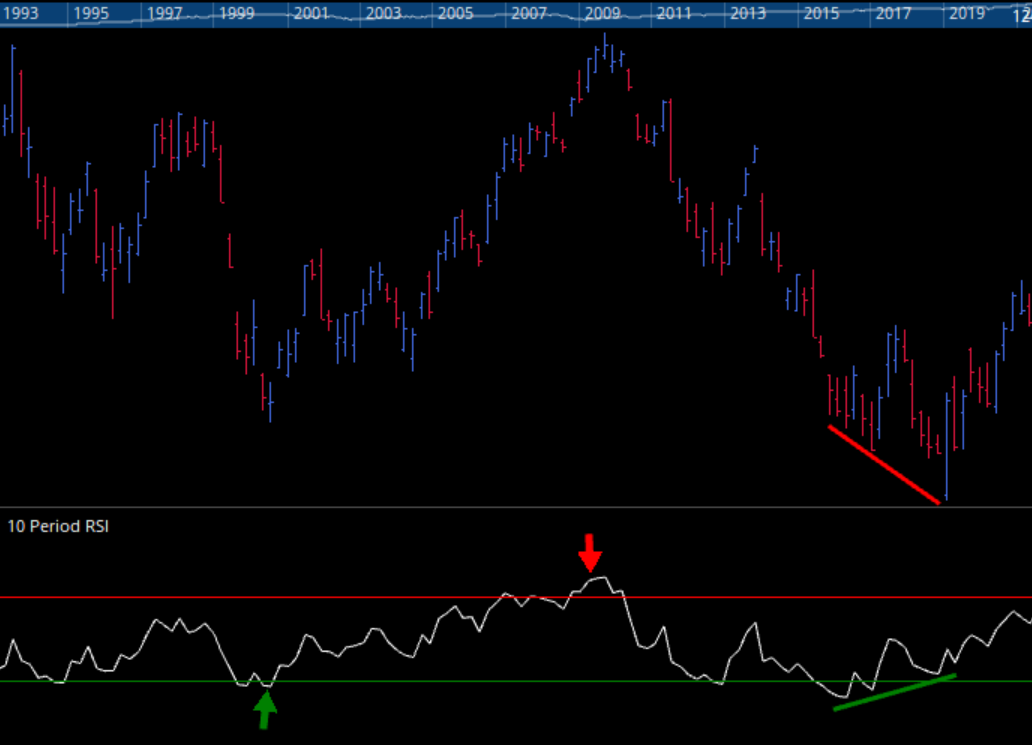
Remember, momentum indicators measure the velocity of price movement. If an asset has moved to quickly in one direction it can move away from intrinsic value. In other words, it becomes overbought or oversold. In the short term, a trader may expect price to mean revert. If we use RSI as an example in the chart below, when the indicator moves into overbought territory above 70 it is considered overbought. When it crosses back below 70 into neutral territory, one might expect price to move lower in the short term (see the arrows in the image below).
Think back to our car accelerating getting quicker more slowly. That is the concept of divergence. If price makes a higher high but momentum makes a lower high this tells us that there is not as much enthusiasm behind this higher high. Perhaps our security has hit its top speed and we will look for it to move lower in the short term. Again, see the example with trendlines on the RSI.
 Optuma RSI SPY divergence
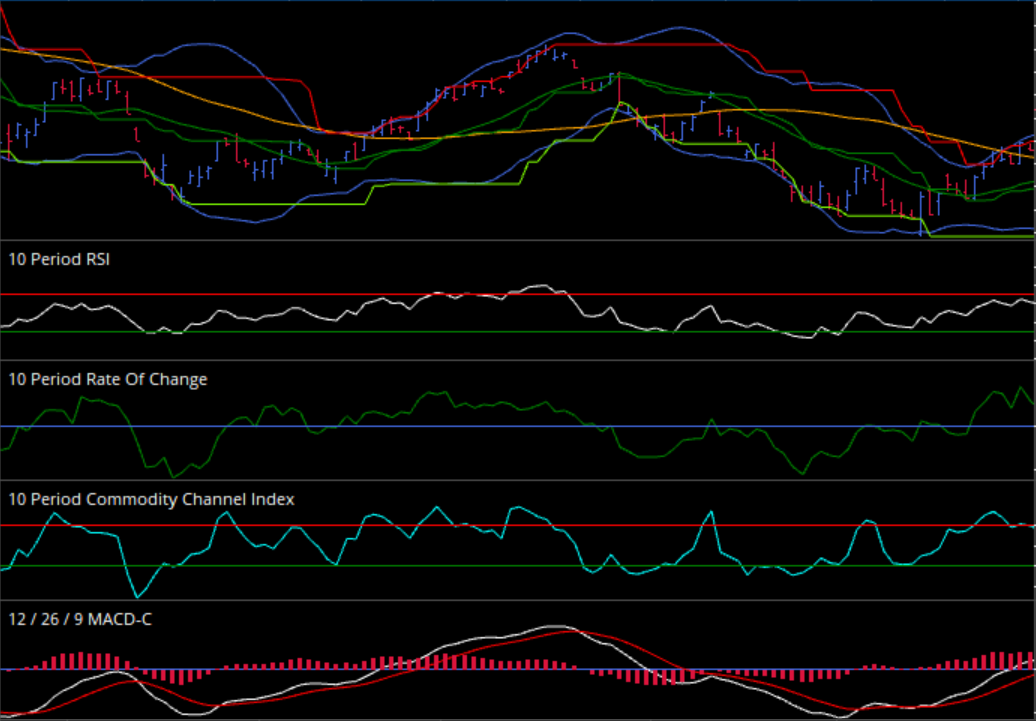
In our recent blog discussing the importance of trend identification (click here), we saw how adding valuable indicators and concepts to our chart could cloud our judgement and leave us more confused than when we started. The same is true here. These three studies attack the problem of momentum differently and each bring something of value to our process. If we add only these three momentum studies to our trend identification chart we can see how difficult we have made our research.
 Optuma SPY with everything
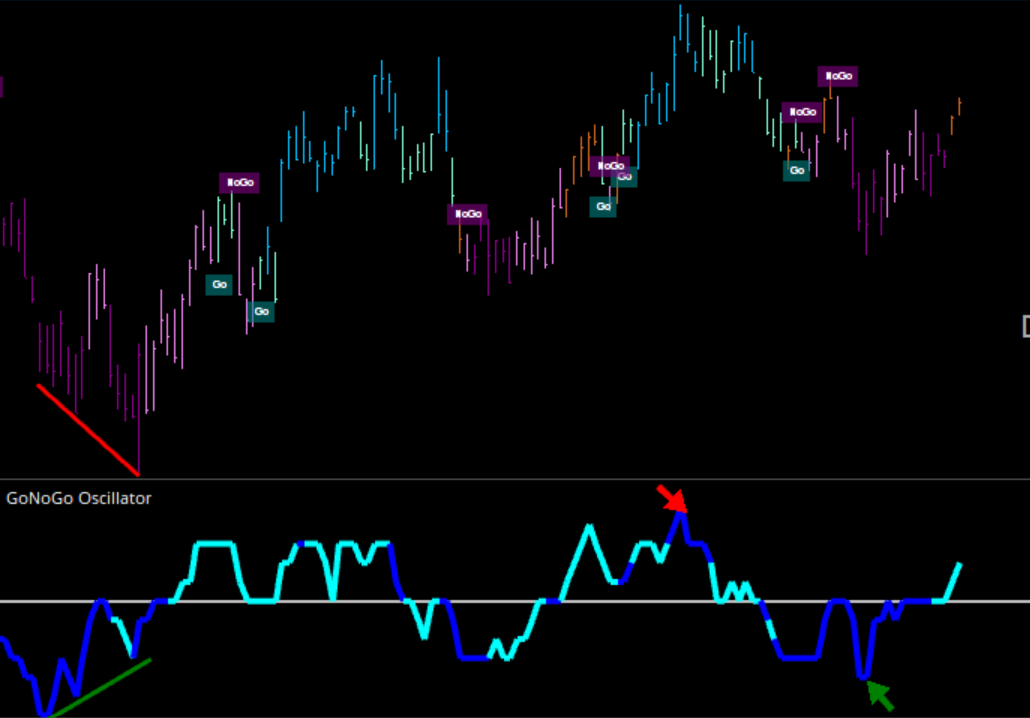
Years of working with professional technicians has taught us that having the information from momentum indicators is extremely valuable. Therefore, we need to ensure we have the insight but without the indecision. With GoNoGo Oscillator we take the same approach that we did with GoNoGo Trend. Behind the scenes, GoNoGo Oscillator calculates several of the most robust momentum concepts into one oscillator that can be added to our chart but still allows us to use momentum to inform our understanding of the price activity. With GoNoGo Oscillator, we still can identify areas of overbought and oversold extremes (highlighted by arrows on the below chart). We also can quickly see divergences (marked with trendlines). Adding GoNoGo Oscillator to our chart we get a sound understanding of momentum analysis. Keeping it all in one panel we ensure simplicity and remove complication.
 Optuma SPY with oscillator
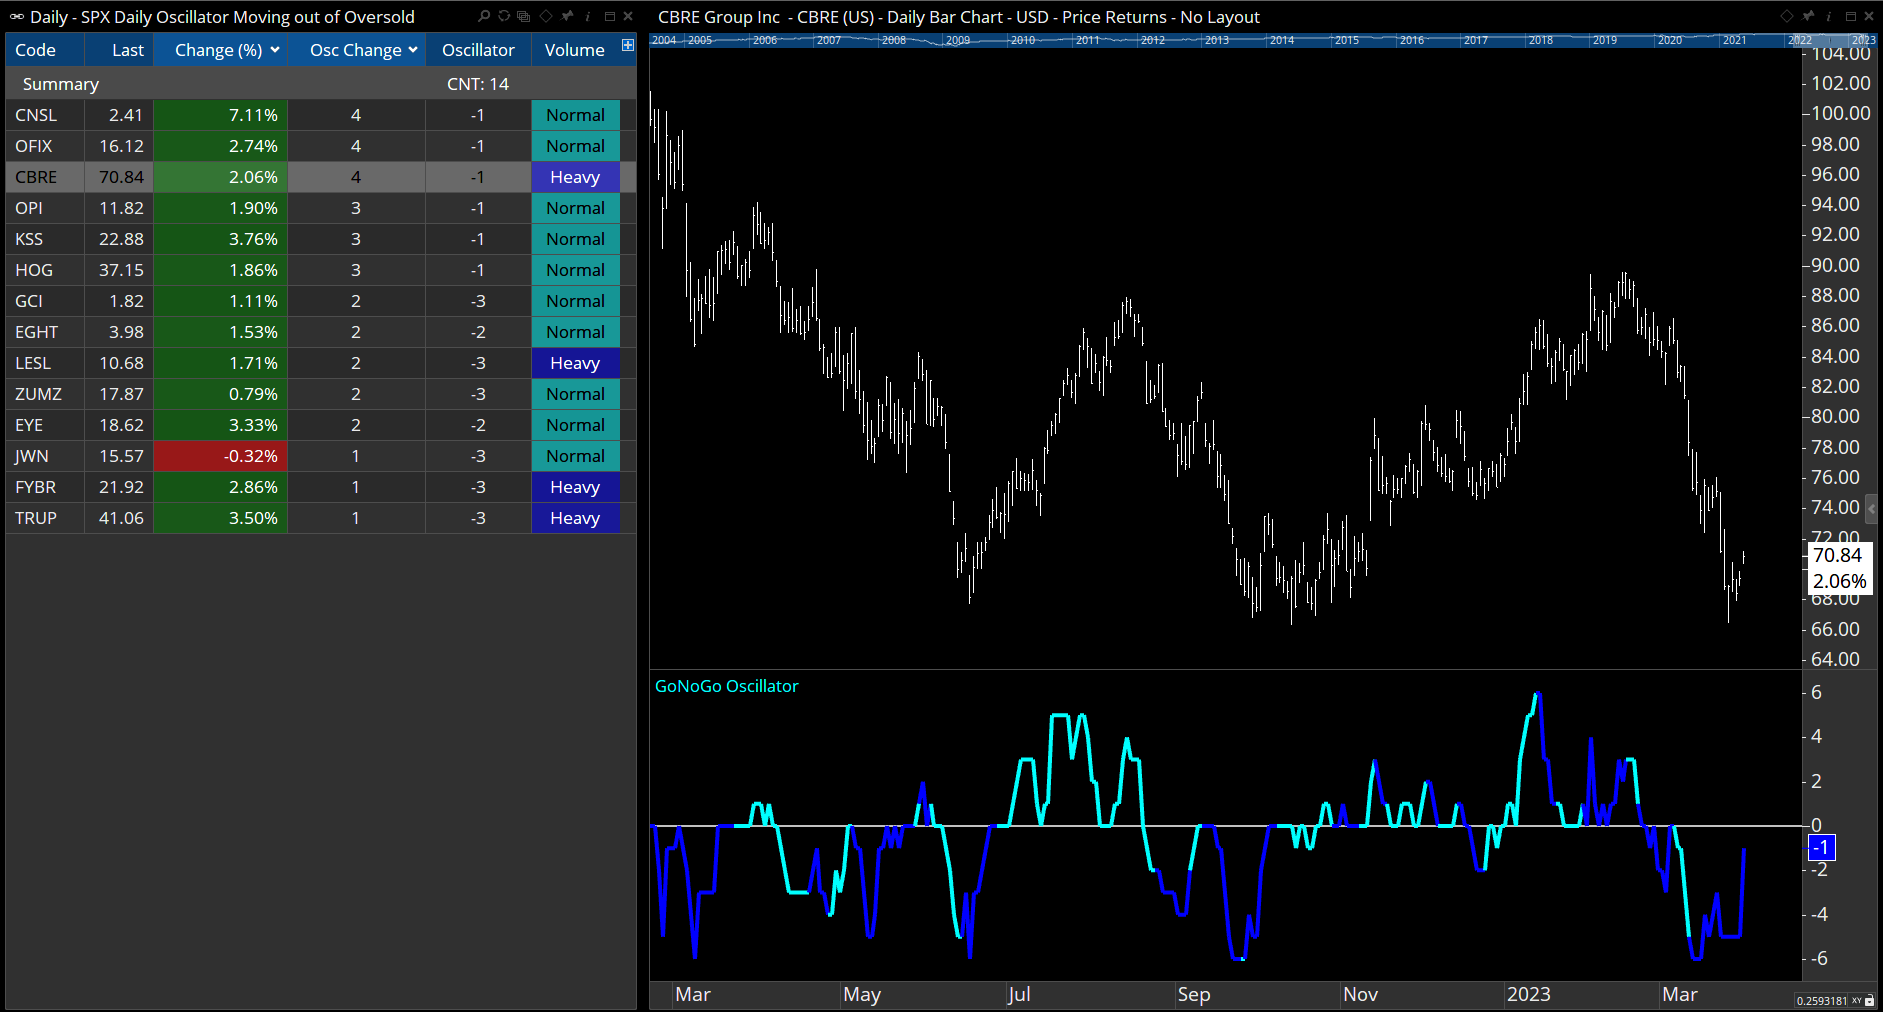
Optuma clients with the suite of GoNoGo tools enabled on their account are able to scan on the GoNoGo Oscillator using the GNGOSC() function. For example, to find stocks that are coming out of oversold (eg crossing above -4) use the following:
GNGOSC() CrossesAbove -4The results below show 14 stocks moved from oversold, with three ($CNSL, $OFIX, and $CBRE) making strong moves from -5 to -1.
 GoNoGo Scan Results
To add the suite of GoNoGo tools to your account (including the Oscillator, Squeeze, and Trend tools) is US$125 per month.
Contact support for a free trial, or click here to sign up.
Get blog updates and Optuma News
