Momentum and the GoNoGo Oscillator
In this article, Alex explains the concept of momentum used in the GoNoGo Oscillator.
How to use our powerful scripting language with Relative Rotation Graphs® to help identify opportunities.
In this updated article new scripting examples have been added, along with updated workbooks for Australian, US, Indian, and Brazilian markets.
One of the most powerful features of Optuma is our scripting language, which allows you to create your own tools, add custom watchlist columns, create your own scans and tools, and design strategies with our testing modules based on any technical criteria you can come up with. Click here for a video showing you where the scripting language can be used in the software.
On the plus side, this gives you a blank canvas where you can write formulas using any of the tools and technical indicators, getting as complex as you like. On the negative side, it’s a blank canvas… where to start? This is especially true with Relative Rotation Graphs® - Julius de Kempenaer’s unique visualisation method of looking at the relative trend of multiple instruments against each other and a benchmark.
If you’re not familiar with RRGs, see Mathew’s video here which describes the theory and how it can help in your decision making. All clients with an Optuma services subscription have access to the RRG Lite version which allows you to create RRGs of your portfolio or index constituents against a benchmark, but Professional and Enterprise Services clients (or Trader Services clients can upgrade for $20 a month) have the ability to write scripts on Optuma’s unique derived indicators.
The derived indicators are based on different data points that can be used scanning and in quantitative testing of RRGs - many of which you will only find in Optuma. The following is a list of the derived indicators available in the JDKRS() function and how you can write a script to utililise them.
JDKRS().RatioJDKRS().MomentumJDKRS().Quadrant == 0 (note that the double equals sign must be used to denote equality)JDKRS().Quadrant == 1JDKRS().Quadrant == 2JDKRS().Quadrant == 3JDKRS().Angle > 0 and JDKRS().Angle < 45 will show the components in the ‘top half’ of the Leading quadrantThe Angle Rate of Change measures the distance of the angle of the current data point of a security, to the previous data point. The greater the value, the larger the distance between the two data points. JDKRS().AngleROC IsUp
This number represents how far away the security is from the centre of the RRG chart (ie the benchmark). One of the observations is that higher alpha comes from those components that make bigger arcs around the benchmark. JDKRS().Distance > 2 will ignore those closest to the centre.
This is the angle that the arrow is pointing to, again based on the points of the compass, and is one of the most useful measures:
JDKRS().Heading > 22.5 and** **JDKRS().Heading < 67.5 will show those heading in a general northeast direction, ie increasing ratio and momentum (see scan result image below).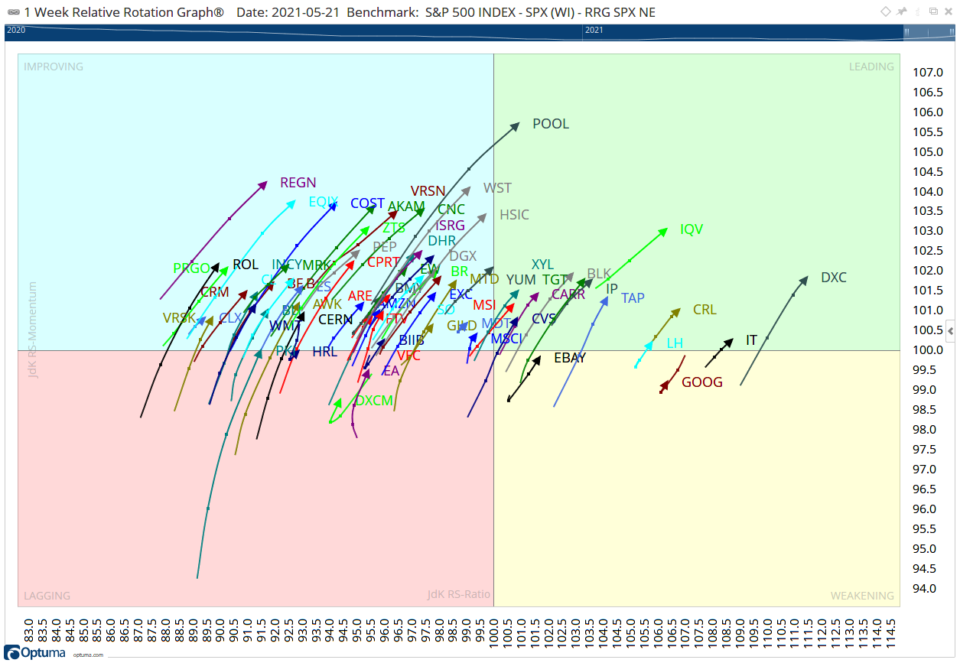 RRGNE2
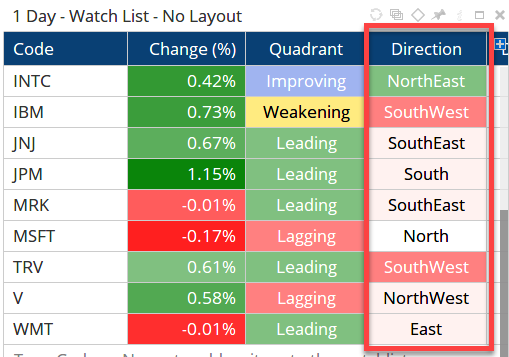 RRG Direction
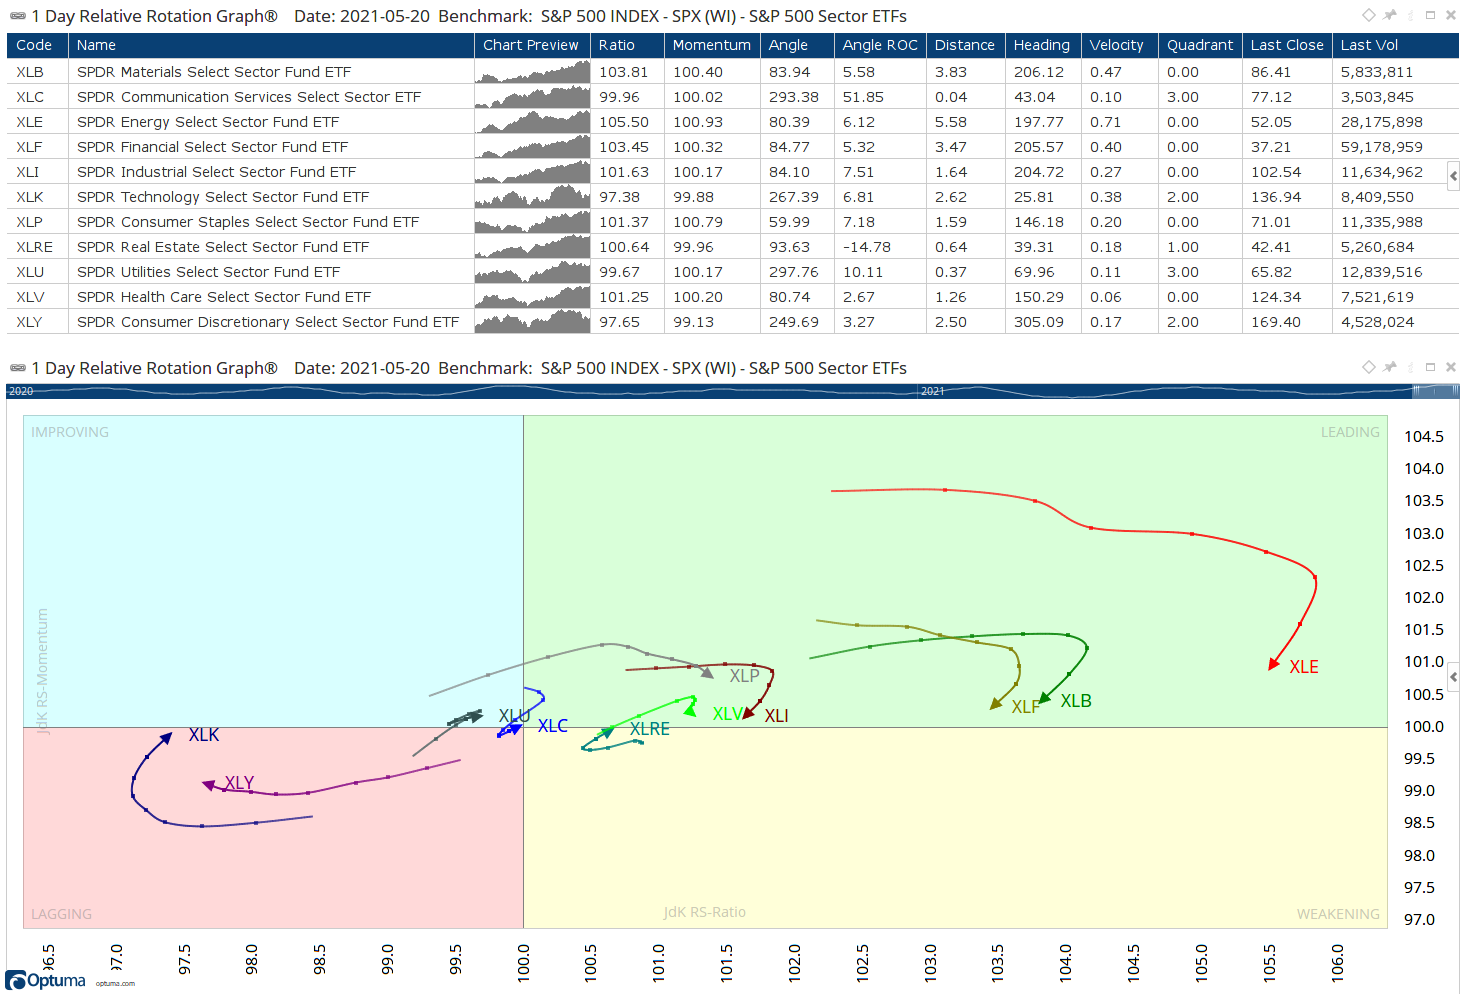
This is the vector difference - or distance - between the last two data points on the line. For more than 3 days of increasing velocity use the DaysUp function: DU(JDKRS().Velocity) > 3 or to display the 5 day tail length in a watchlist, with the longest having the highest relative momentum:
1
2
V1=JDKRS().Velocity;
ACC(V1, RANGE=Look Back Period, BARS=5)
Here are the RRG values displayed as a Watchlist by ticking the Grid View property, with the corresponding RRG below:
 US Sectors
Of course, you can create scans with multiple criteria based on any other technical indicator combined with RRGs, eg Heading between 30 and 60 degrees, with a distance > 2 on increasing velocity, but only for stocks where the 50 period moving average is also sloping up:
1
2
3
JDKRS().Heading > 30 and JDKRS().Heading < 60 and
JDKRS().Distance > 2 and JDKRS().Velocity IsUp and
MA(BARS=50, CALC=CLOSE) IsUp
Note: if using the scanning manager the results can be exported as an RRG, and saved as part of a workbook. When that RRG is next opened the scan is run again and the results automatically updated.
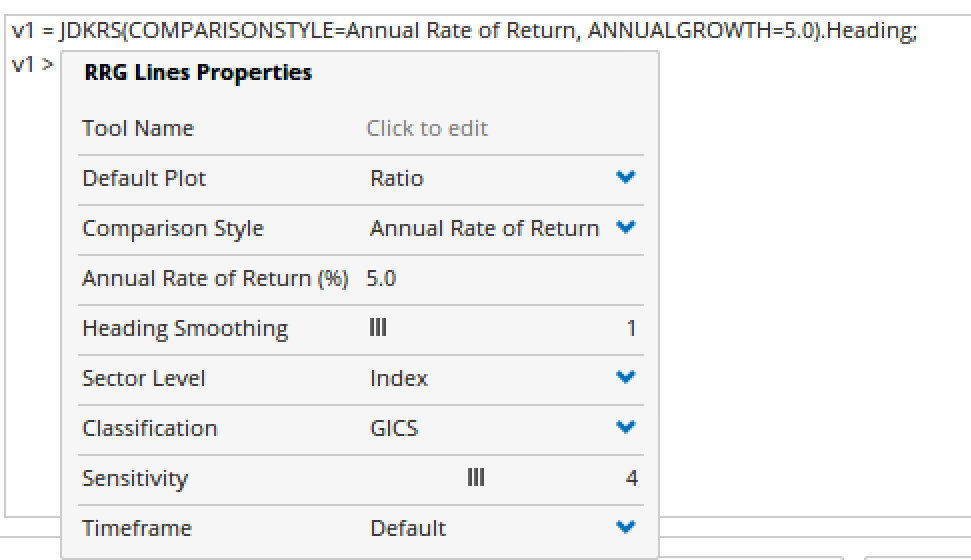
If you don’t specify the benchmark to be used the main index of the country of where the stock is listed will be used by default (ie XJO for Australia, SPX for the US). To change it, click on the JDKRS() function in the script editor window and change the Comparison Index to another index, or even the Comparison Style to Annual Rate of Return and specify the value.
 RRG Line Properties
Another benefit of being on the full version of Relative Rotation Graph module is the ability to create RRGs on foreign exchange. The scripting function for this is JDKFOREX() and includes the same derived indicators as for standard RRGs. The example below shows the major currencies (and gold) relative to the US dollar on a daily basis.
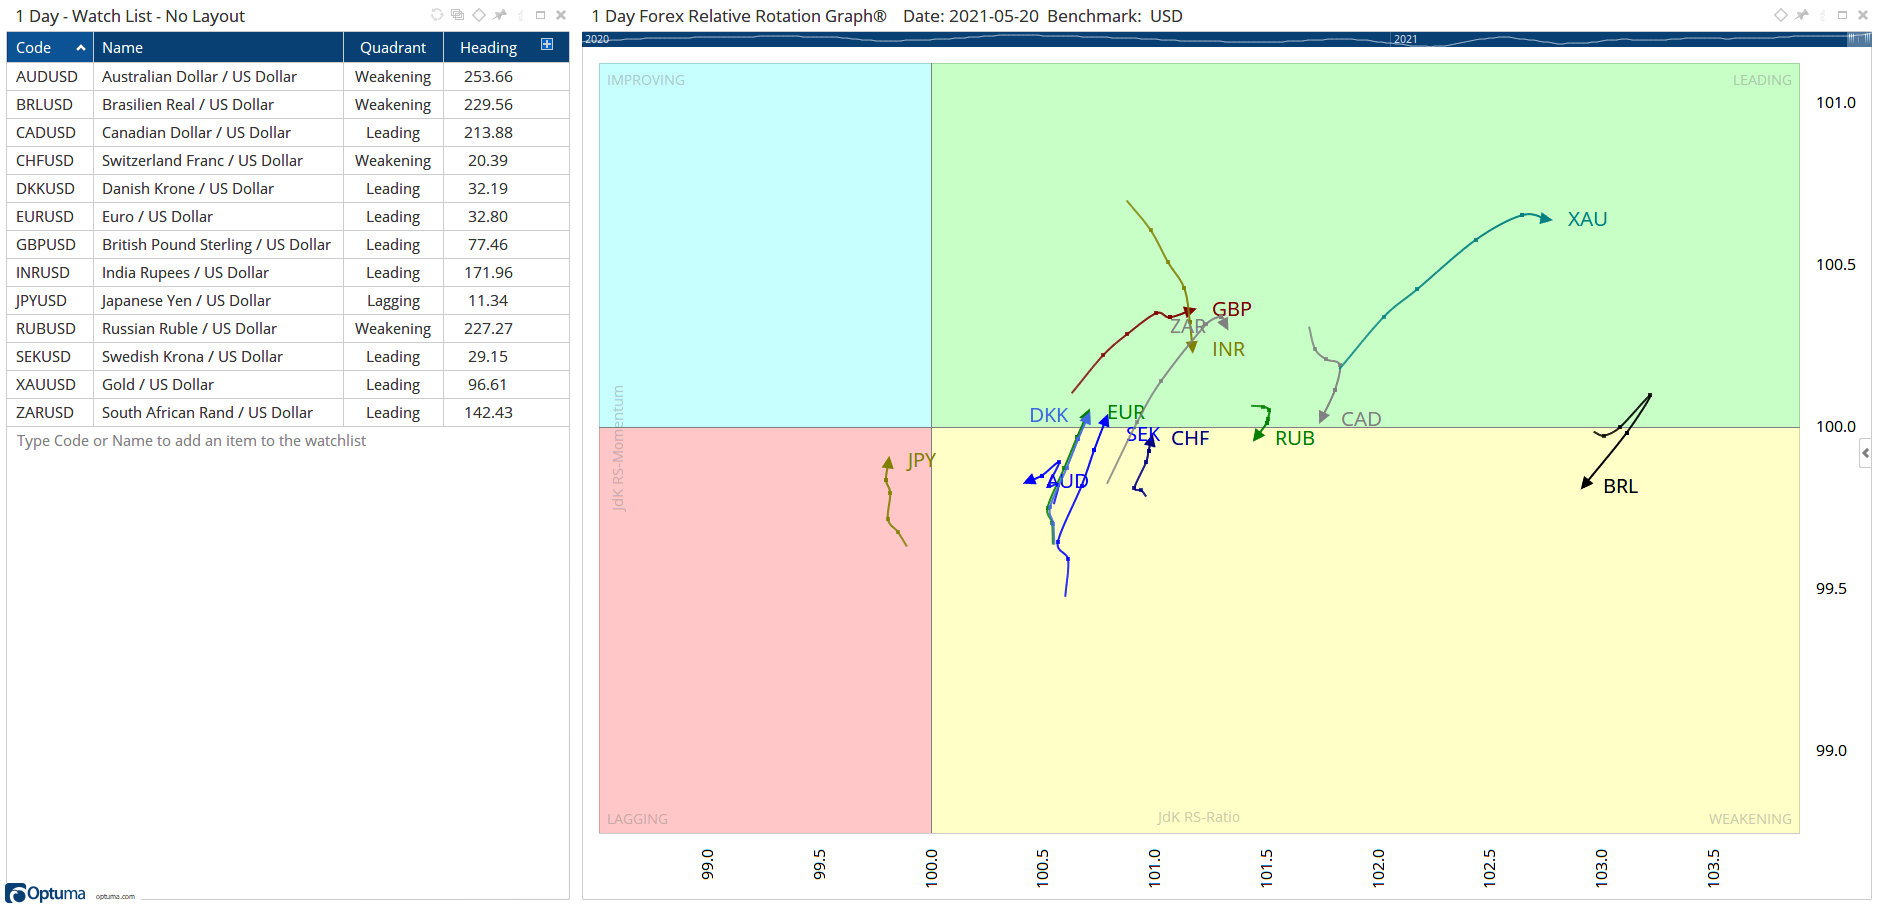 Forex RRGs
For more on the Optuma scripting language see our online video tutorial course.
Clients can also log in to the Scripting Forum to post questions and see lots of examples.
We understand that it can take time to get up to speed with learning to create your own scripts, and we’ll help where we can, but we also offer consulting services to help you design and test your strategies. Contact us for details.
Click the buttons below to save the workbooks for the ASX, US, Indian, and Brazil markets. Note: you will only see all the charts and watchlist columns if you have the exchange data and full RRG module enabled on your account.
Get blog updates and Optuma News
