Optuma for Analysts

Everything you need for market research.

For professional analysts creating research for portfolio managers, team, and subscribers.

For your unique process

With over 500 charts and indicators to choose from, you can analyse the market any way you want. Layer and combine as many tools as you need.

No-code backtesting & scanning

Quickly scan the market for setups or build backtests in a easy-to-use no-code environment. Backed by AI so you no longer need to know how to code.

Easily share research

We understand you need to show your research. Whether it's to clients, managers, or subscribers, it's easy to share quick charts to full reports.

As a fund manager and trader, I need a consistently reliable tool that can not only do the simple things such as trend analysis but allow me to undertake advanced analysis in market timing and other advanced theories, which Optuma does with ease. I also need to collaborate with other analysts, create presentations and many other things in my role, and it seems that no matter what road I chose to take my analysis down or what my needs are Optuma already has what I need before I even know I need it.

Dale Gillham
Chief Analyst, Wealth Within

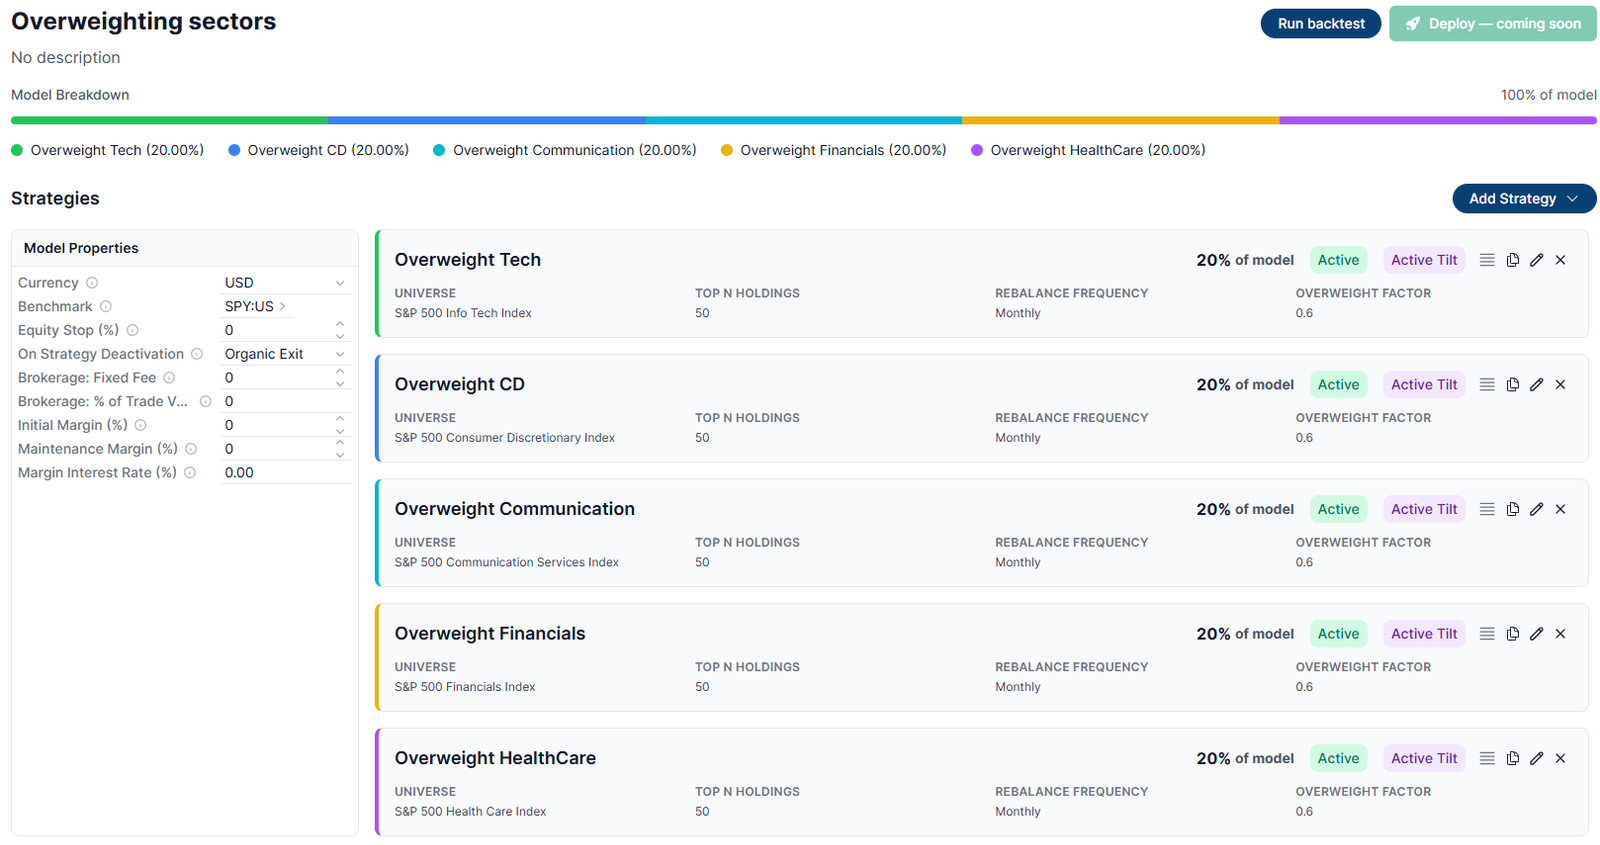
Model builder multiple strategy overview. Overweighting US sectors

Test ideas & strategies in seconds

Backtest any idea you have, with both fundamental and technical rules. Built to be easy to use, it lives in a drag-and-drop environment and has AI ready to help if you need to write code.

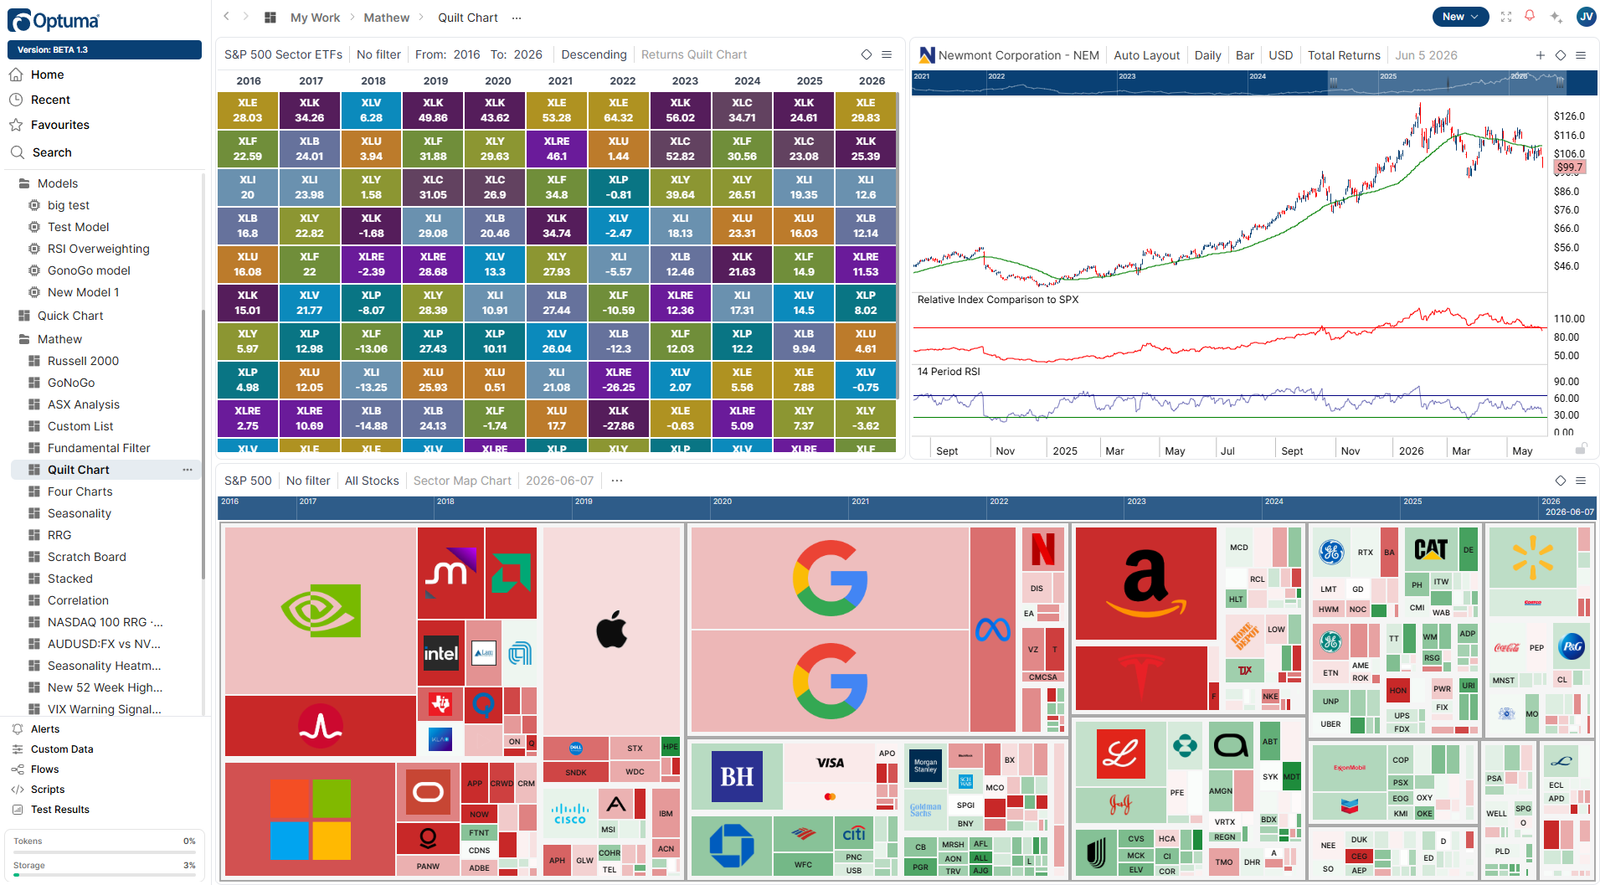
Chart board in Optuma

See the market any way you want

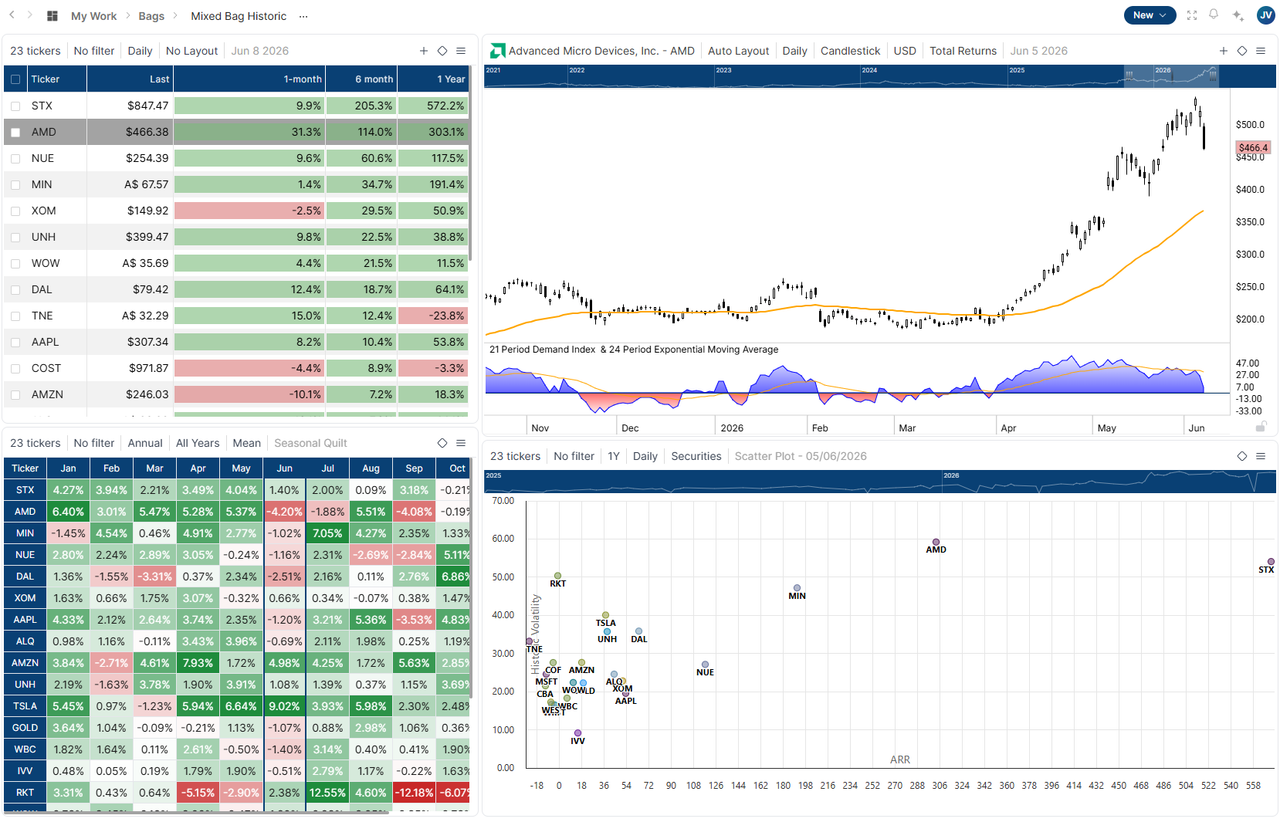
No matter your research process, Optuma is able to support you. Access over 500 charts & indicators, and use both price and fundamental data to build your analysis.

Easily move from charts to presentations

We know the most important part of your role is showing your value. In Optuma, it is fast and easy to turn your research into impactful presentations and reports.

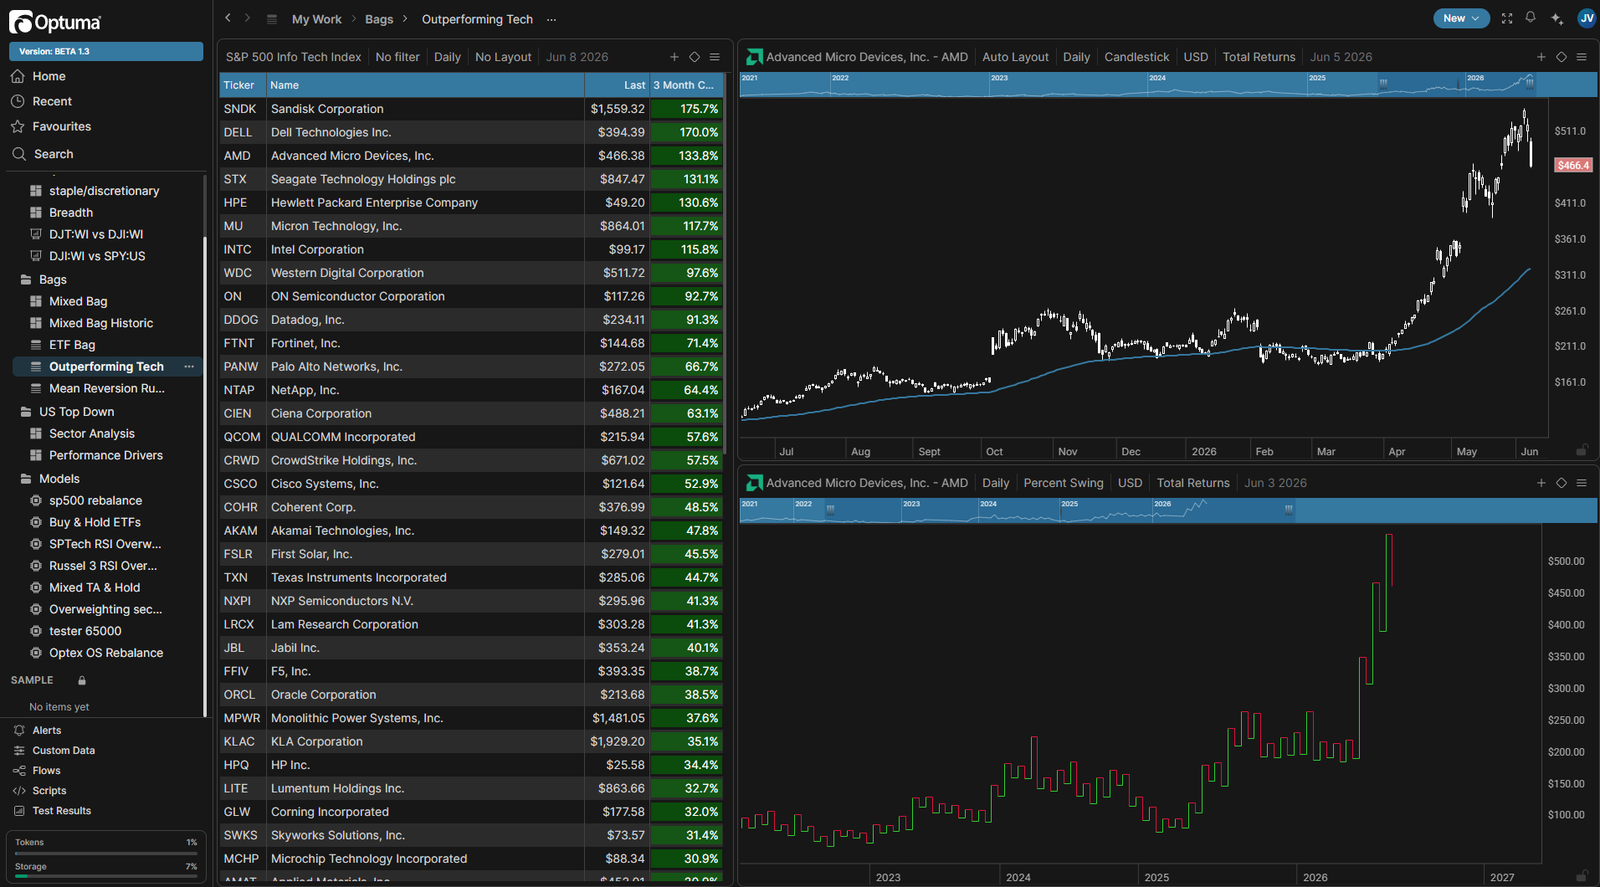
watchlists in optuma with two charts next to it.

Helping you find the next opportunity

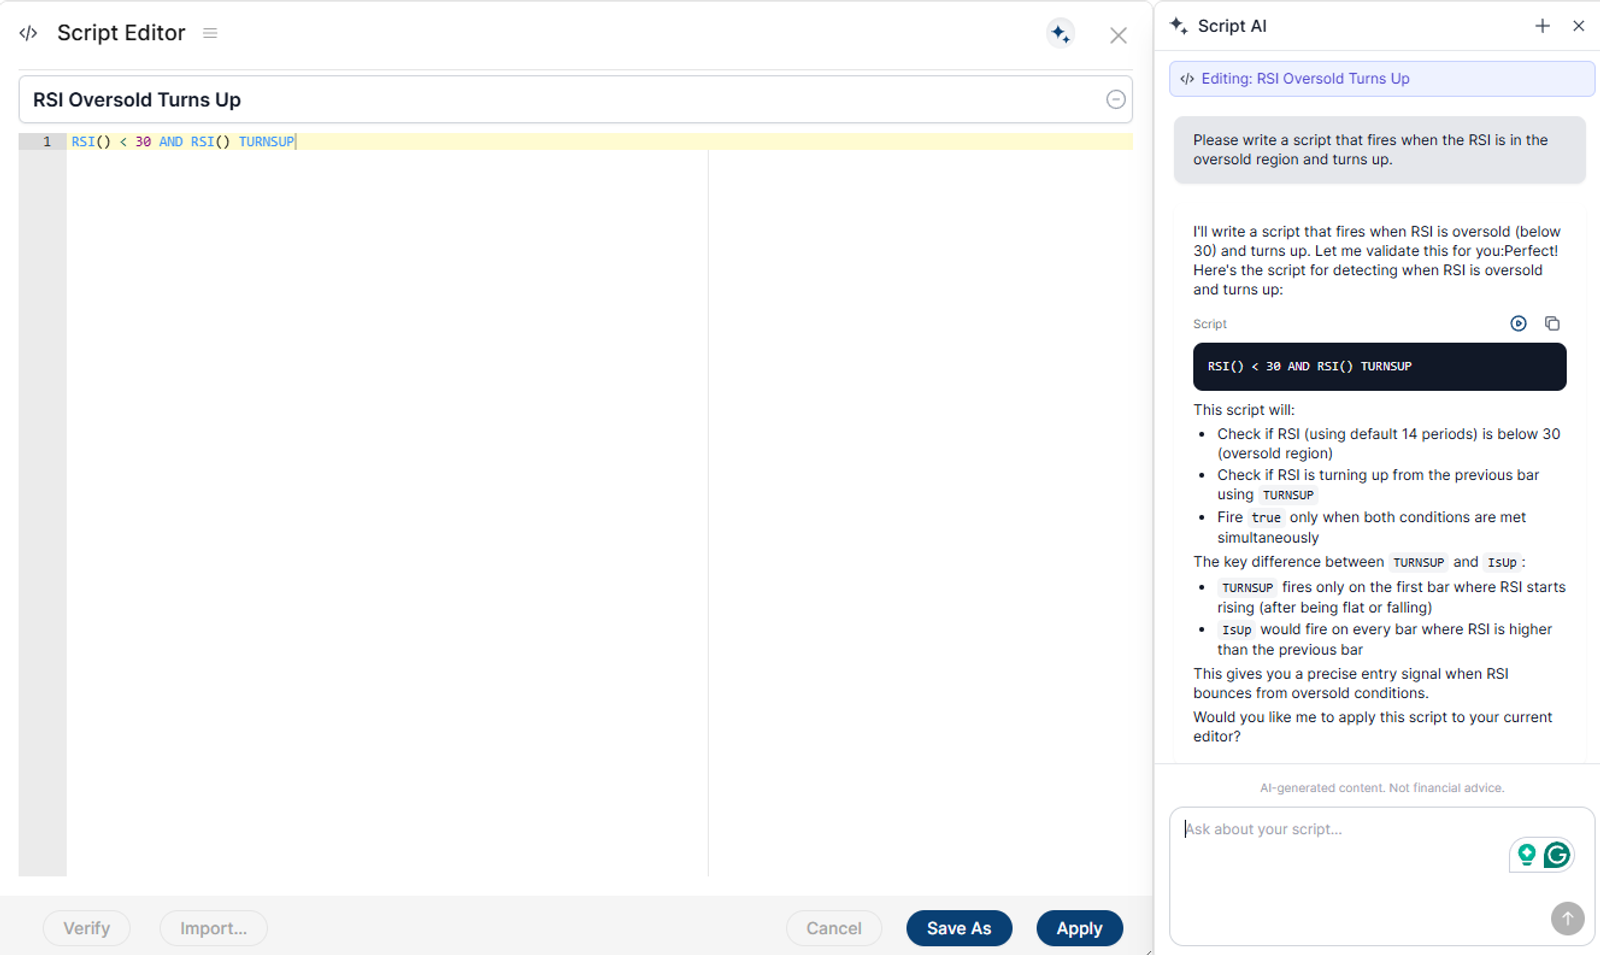
Build scans on what you cover so you know when opportunities happen. Just like the backtester, you can build scans in a drag-and-drop environment with AI backing you up when ideas require code.

AI in the script editor.

Everything backed by AI

AI is built into Optuma to help you save time. It can build charts, give you tutorials, write code for the model builder, and edit indicators. All while being incredibly secure, and never taking full control away from you.

Request a Demo Today

Get hands-on with the platform and explore the tools analysts rely on every day.

Book My Demo

Frequently asked questions

No. Optuma's scripting language is designed to read like Excel formulas. Most workflows — scanning, testing, and indicator building — work entirely without code, and Optuma's built-in AI can translate your ideas into working scripts.

Yes. Optuma includes a research-publishing workflow that turns your charts and analysis into branded, presentation-ready documents. You can also share interactive Optuma workspaces with teammates.

Optuma complements rather than replaces market-data terminals. Optuma provides deeper technical analysis, no-code scanning and testing, and research publishing, so most analysts use Optuma alongside their primary data terminal.

Yes — if you provide market research, work as a buy-side or sell-side analyst, are a technical analyst, or are a CMT charterholder who needs professional charting, AI-backed scanning, and the ability to publish client-ready research.

Choose which categories of cookies you allow. Strictly-necessary cookies are always on. You can change this any time via the "Cookie Settings" link in the footer.

  • Functional

    Remember preferences like dismissed banners and your dark-mode choice.

  • Analytics

    Help us understand how the site is used so we can improve it.

  • Marketing

    Measure our advertising and help us reach people who may be interested in Optuma.