Screen Layout
Overview
This section will help familiarise you with the layout of the charting screen.
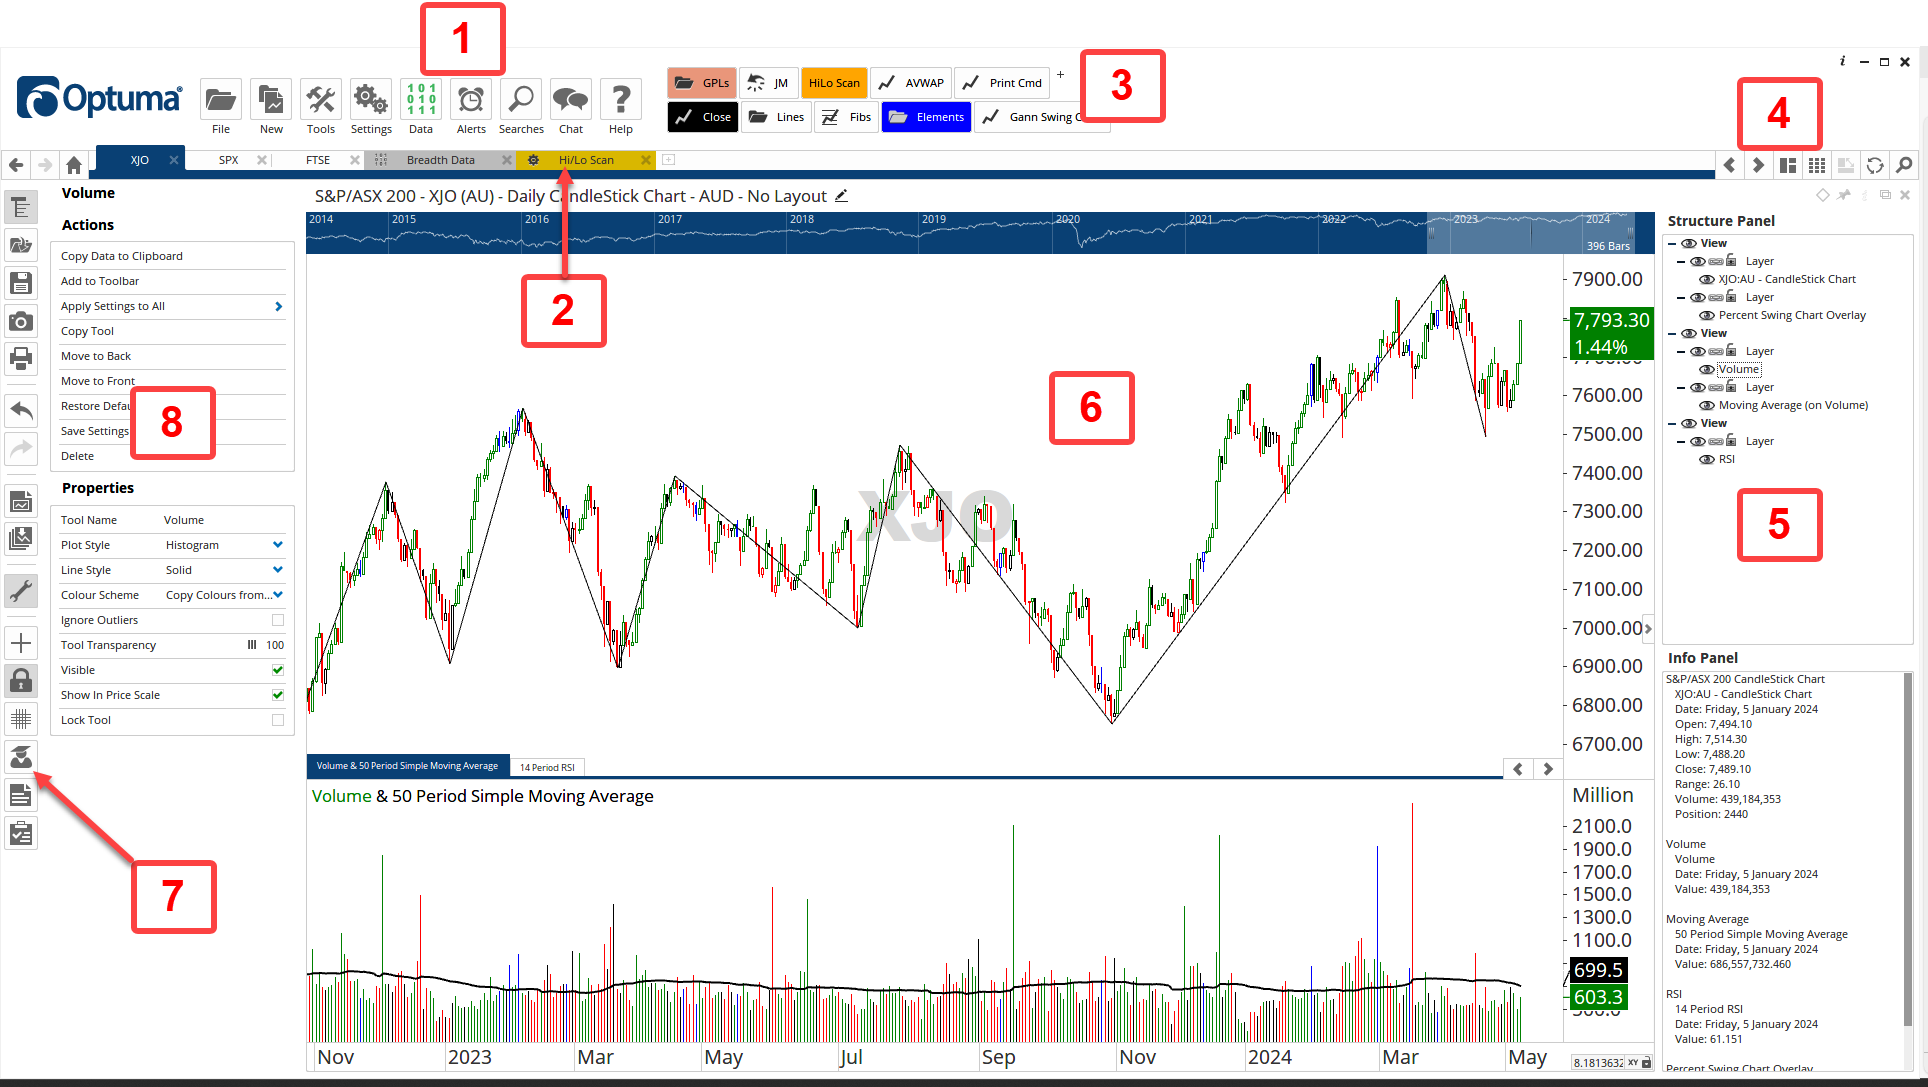
1. Menus: Menu buttons are used to access most of the general functions available in Optuma. This includes opening charts, selecting tools and adjusting general settings.
2. Page Tabs: Page Tabs allow you to navigate between the various charts you have opened.
3. Custom Toolbar: Tools and Actions you use on a regular basis can be added to the toolbar for faster access.
4. Page Controls: These icons allow you to search for charts, apply Page Layouts, and move through page tabs.
5. Structure Panel: Chart and Tool Layers are displayed within the Structure Panel. Layers can be hidden, moved or deleted via the Structure Panel. Also contains the Info Panel giving tool and indicator prices at the cursor position.
6. Charting Window: All new charts will display here.
7. Action Bar: The Action Bar allows quick access to various functions such as saviing workbooks, taking screenshots, and activating/deactivating utilities such as the price lock and grid. A description of each icon will pop up when it is moused over.
8. Control Panel: The Control Panel, displayed on the left-hand side of the chart, is the hub for all actions property settings performed on the object currently selected (such as a chart, watchlist, tool, etc).
Video
This video is pulled from the Optuma 101 course that you can access here. This course takes you through the basics of Optuma and helps you get up and running and using Optuma to its full potential. This video gives an overview of the Optuma screen layout and how you can use and adjust it to best suit your needs.