A few years ago I picked up an old copy of a book by Michael Gur called The Symmetry Wave Trading Method. Gur introduced the concept of using a series of swings based on the Average True Range of a chart, or the ATR.
A few years ago I picked up an old copy of a book by Michael Gur called The Symmetry Wave Trading Method. Gur introduced the concept of using a series of swings based on the Average True Range of a chart, or the ATR. This was one of those “ah-ha” moments. I’ve always liked swing charts but knew that we needed to do something to factor in volatility if we want to achieve consistent swing-based rules across multiple securities.
Basically, a Swing Chart shows up and down price movement of a minimum size regardless of the time it takes to move - much like the trend of the market. In fact, WD Gann called his Swing Chart the “Master Trend Detector”. There are a variety of swing charting methods used. Where each of the methods differ is in how they define when a change in the swing’s direction should occur. There are some that are obvious – like Point Swings that require a retracement of a number of points for the swing to turn, or Percent Swings that measure the retracement in terms of percentage change. Others are not so obvious. Gann Swings look at the relationship between successive bars on a bar chart to determine when the swings should change.
Gur suggested in his course that the retracement determining when the swings change should be measured in terms of the number of ATRs. The Average True Range has become recognised as a reliable measure of volatility – measuring the average extreme movement of price from one day to the next. This means a security that oscillates wildly will have a higher volatility measure compared to one that has much smaller movements.
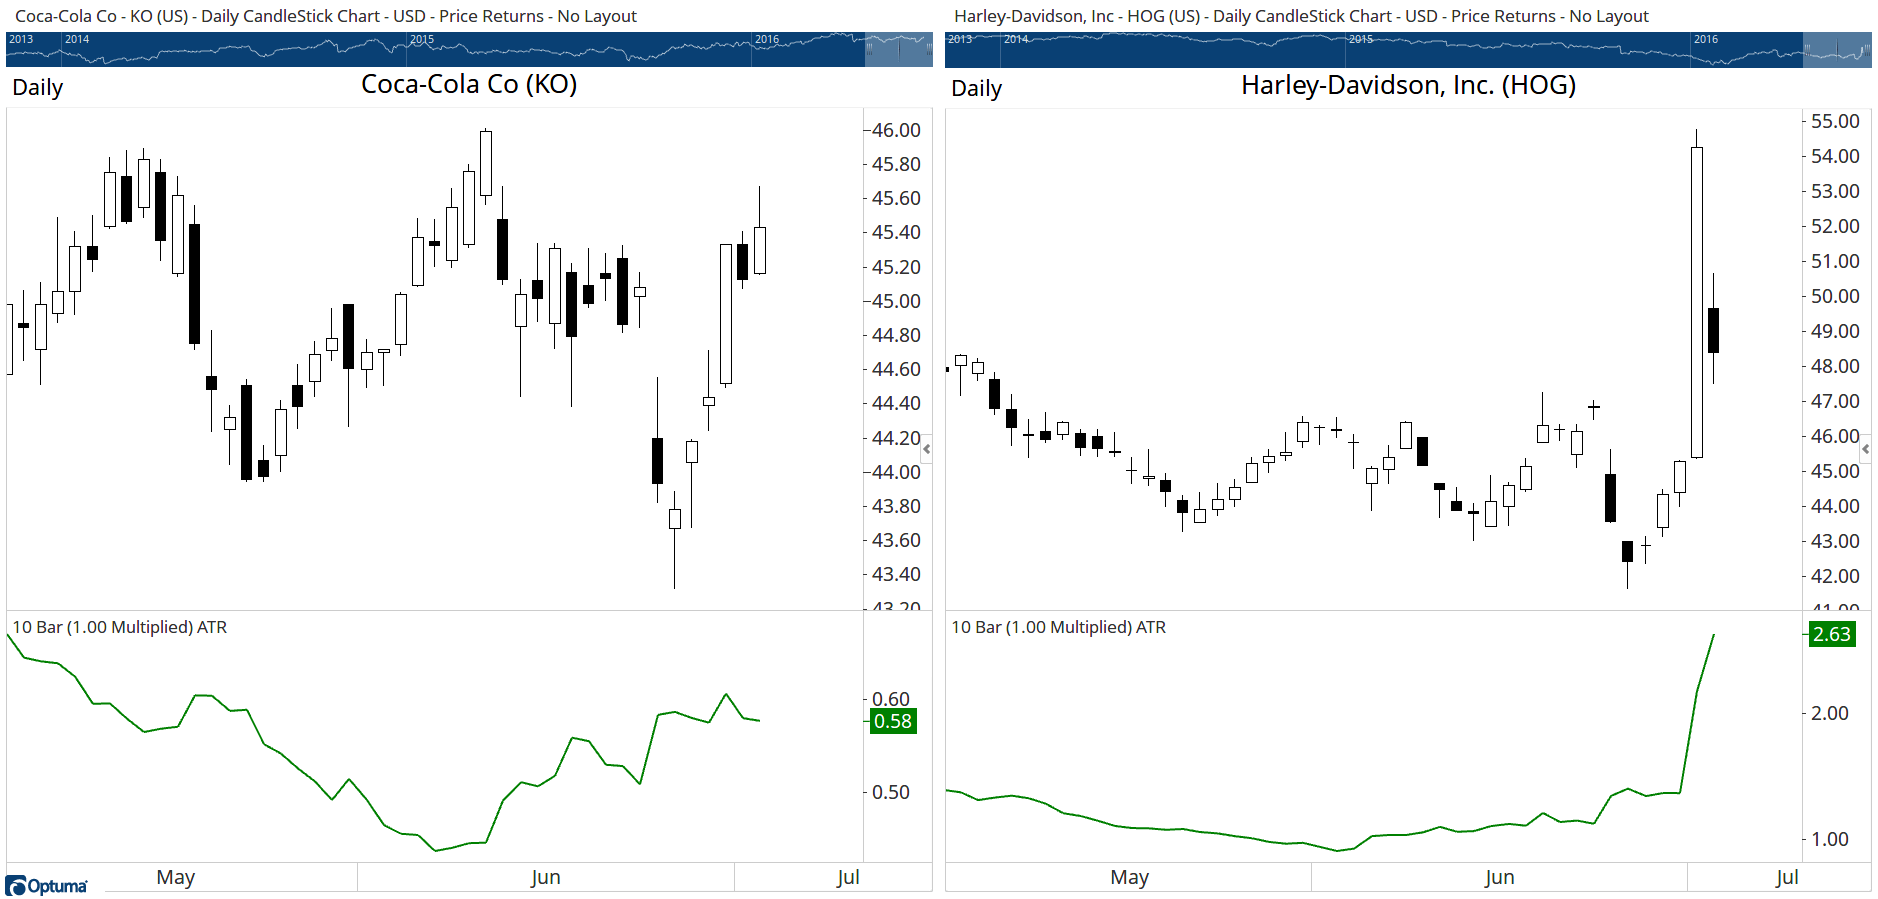
The following two charts of Coca-Cola (KO) and Harley Davidson (HOG) highlight this. They both are valued in the $45 range, but they have very different volatility values (0.58 vs 2.63). Under each chart you can see the ATR indicator. You will notice on the right that Harley Davidson had a major spike in its share price which led to a higher ATR value.
For a major Swing Gur would use 4 ATRs, meaning that the price would need to retrace by 4 times the value of the ATR for that day. Again, taking the two charts above, what would the price need to fall to for the swing to turn down?
With Coca-Cola at an ATR value of 0.58, it would need to retrace by $2.32 from the high before the swing would turn down. With Harley Davidson at an ATR value of 2.63, it would need to retrace by $10.52 from the high for the swing to turn down.
You can see these two similarly priced stocks have very different thresholds for when the swing turns. And rightly so. If we had just used Points, we would be hard pressed to find a point interval that’s suitable for both. By using the ATRs, we’re able to ignore the “typical” noise of the security and only respond when there has been a significant change of trend.
An Extra Bonus
Because the ATR value is adaptive, the ATR will drop in value as the market goes sideways. As the ATR drops, so does the size of the required retracement for the swing change. This means that as the market trades sideways the swing may turn.
Numbering Swings
One of the great concepts that Elliott brought to Technical Analysis is the concept of numbering waves. Gur did the same thing, although there is no limit to how high the count can go.
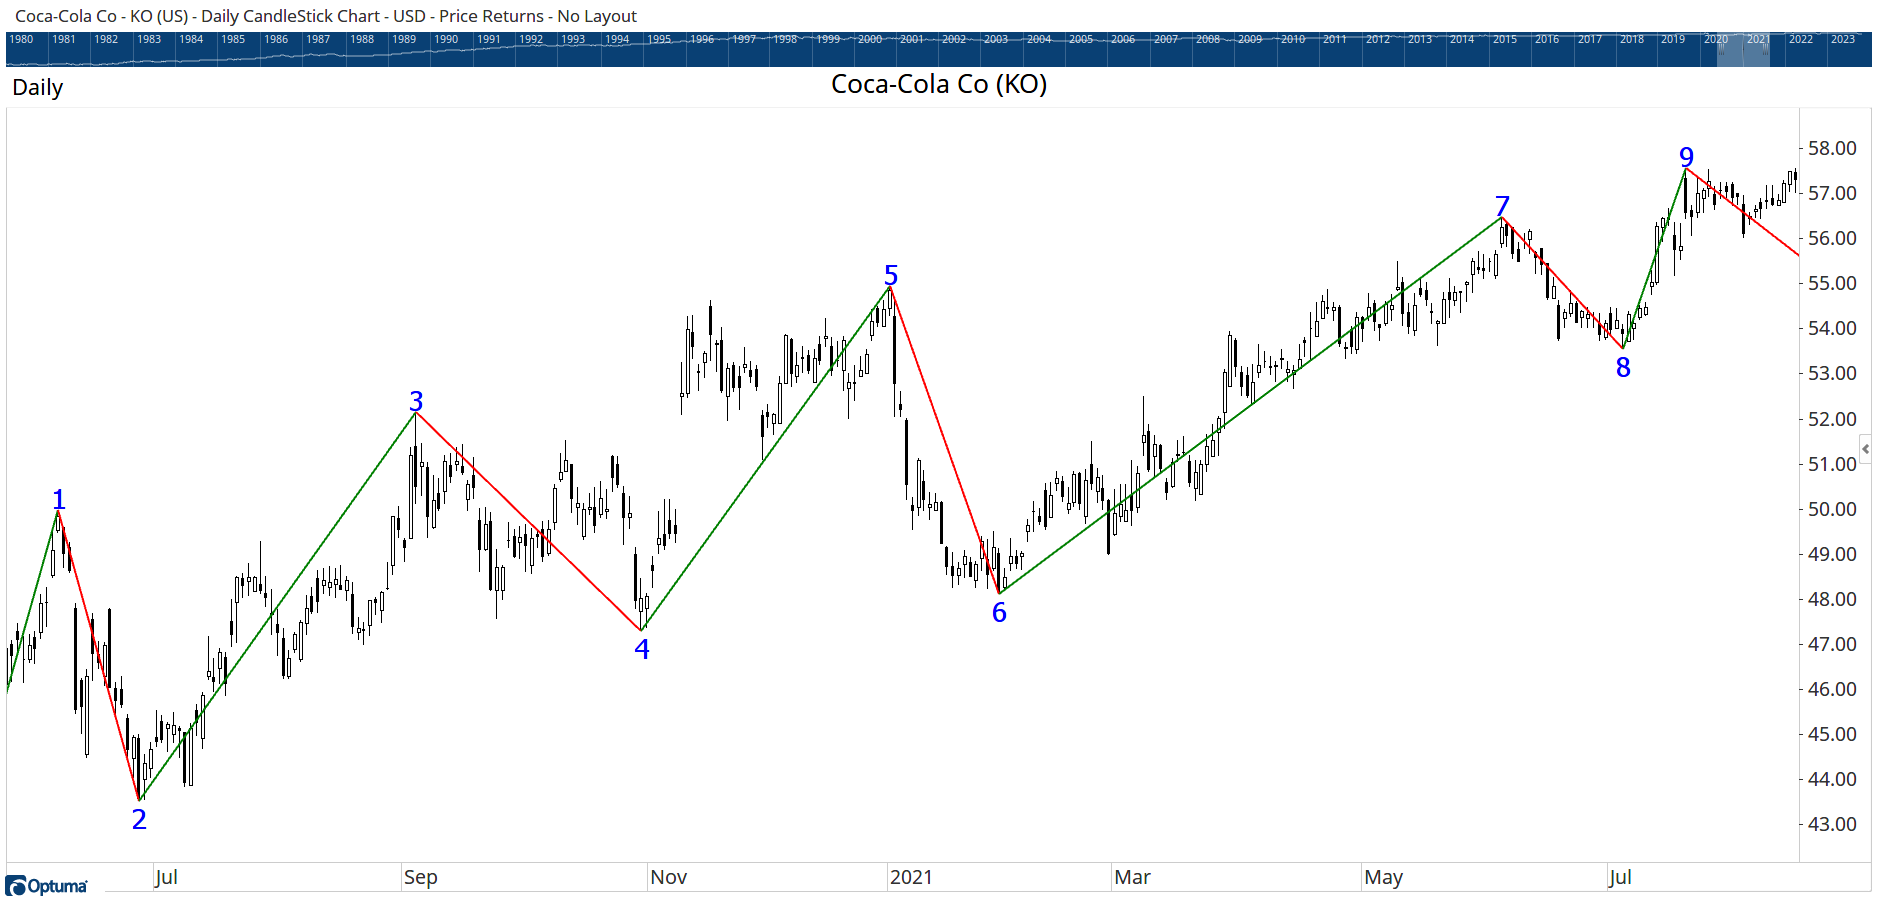
In this image you can see the end of the swings are numbered. There are a number of rules that Gur introduced in his course:
Odd-numbered swings are in the direction of the main trend.
Successive odd-numbered swings MUST extend past the previous odd-numbered swing. E.g. in the chart above, Swing 3 must end higher than Swing 1, etc.
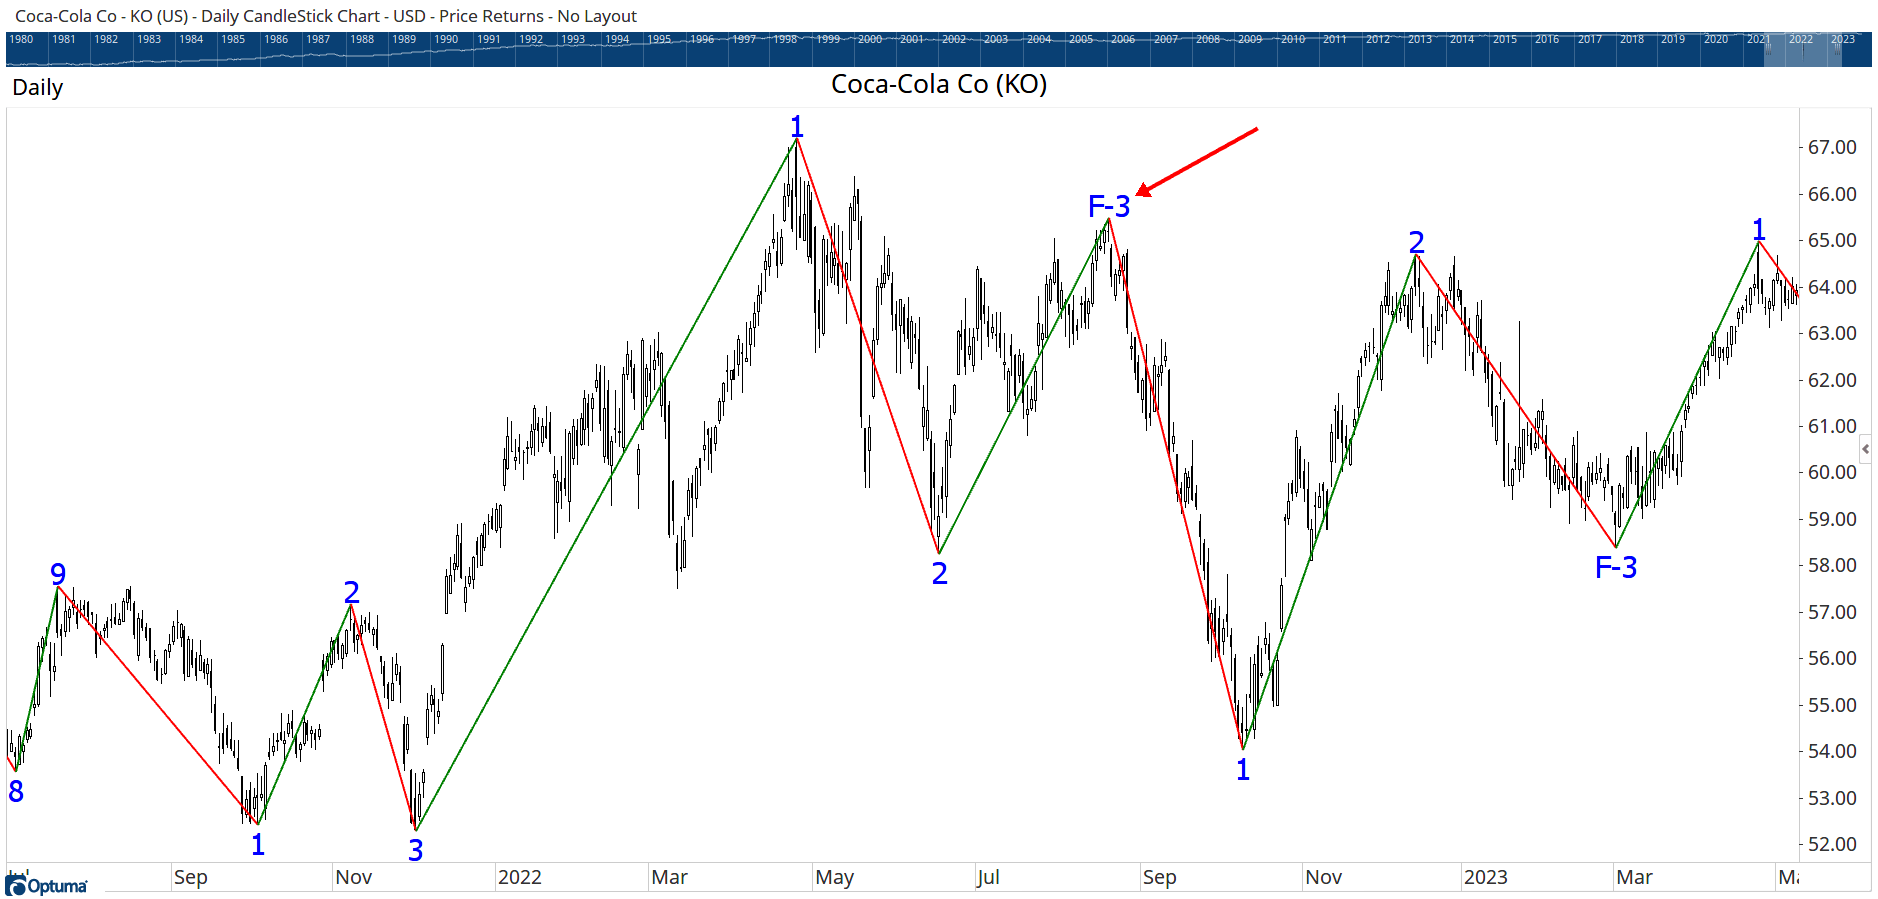
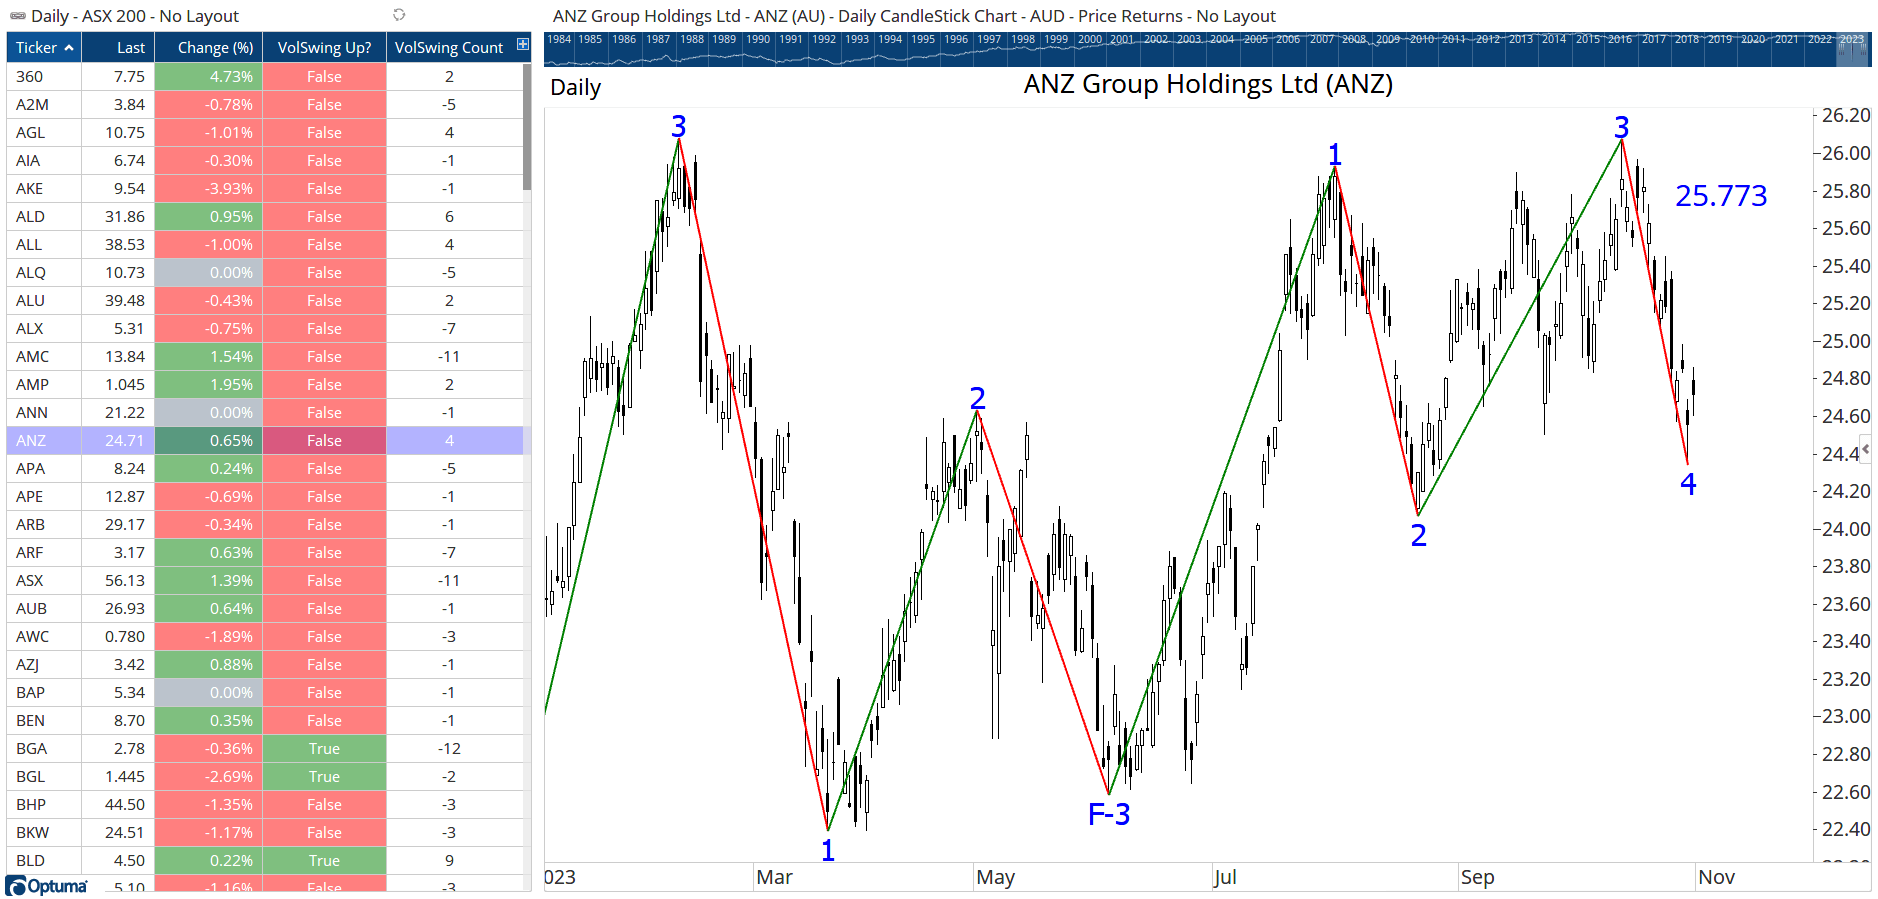
If an odd swing fails to extend past the last odd swing, it is called a “Failed” swing and gets an “F” prefixed.
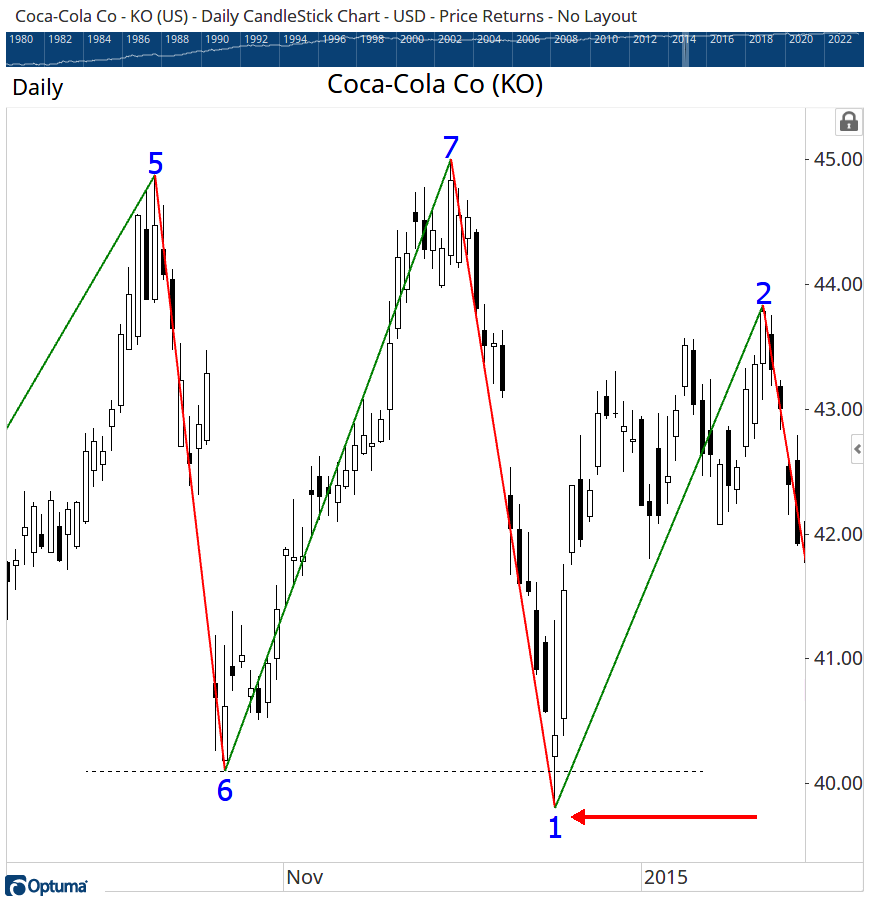
If an even swing extends part the last even swing, then it’s the start of a new number sequence in the opposite direction. In this image you can see that what would have been Swing 8 went lower than Swing 6, and so it became a new Swing 1 going down.
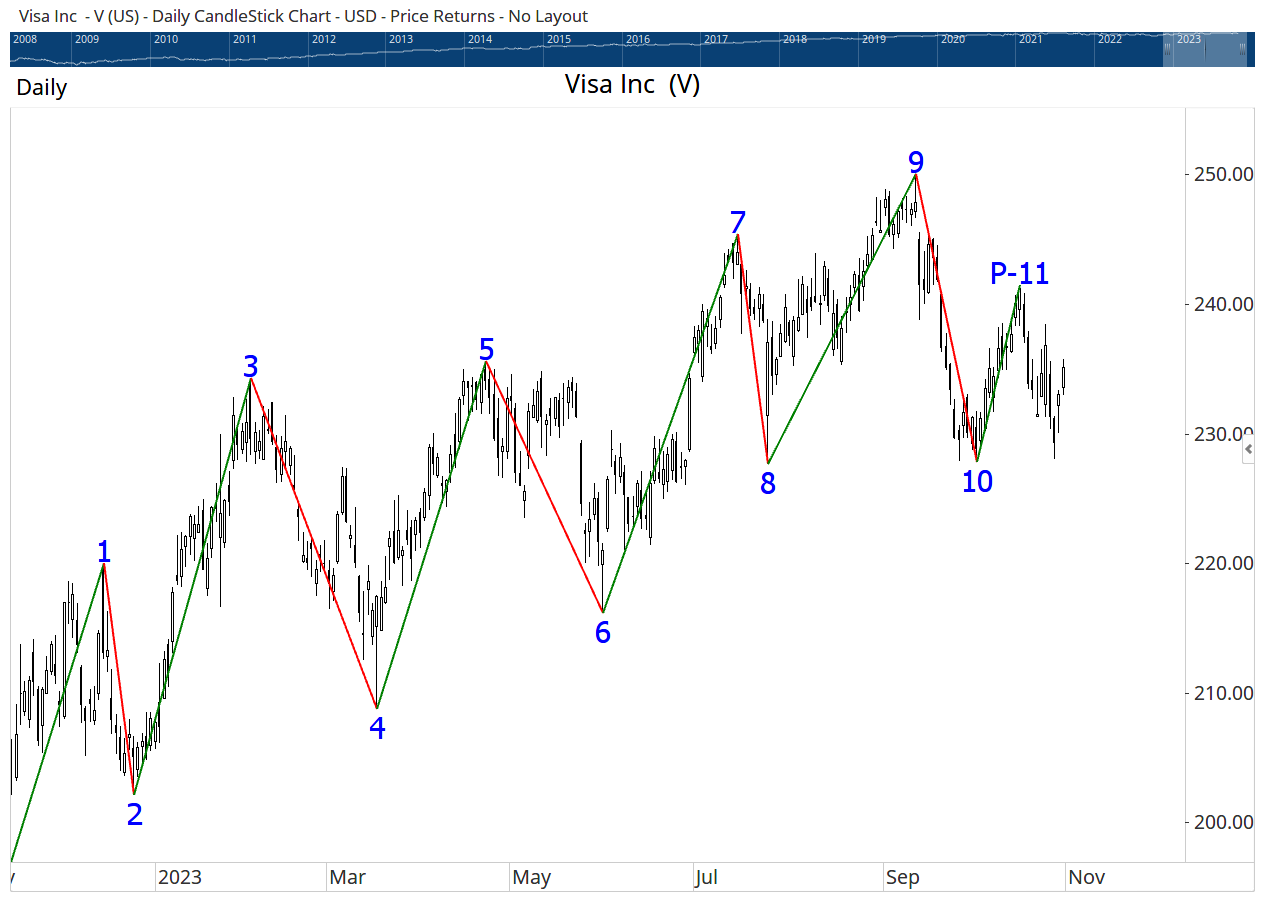
When a swing reaches the required ATR measure to change direction, but may not yet have passed the previous odd swing, it is called a “Potential” Swing. E.g. in this image of Visa we have a P-11 - meaning that it has retraced by the right number of ATRs but to be a “real” Swing 11, it needs to extend past Swing 9. If it fails and turns down, it will become a Failed Swing 11 (F-11).
My goal was to see if we could find opportunities that had a high probability of identifying successful trades. This was all done before we built the new Signal Tester in Optuma. It’s an area that we want to get back to, but two early observations we noticed are:
A failed Swing 3 (essentially a lower top) has a very high probability of indicating the start of a down move.
It’s rare to get sets of swings that go beyond Swing 5. As the counts get higher, the probability of a change in trend is getting higher (so we’ll be keeping an eye on Visa!).
These swings are a great way to identify the direction of the trend while considering the volatility of the security.
We can even add the Volatility Swing as a filter in other quantitative work that we are doing. Here I added it as a true/false column in my Watchlist—depending if the swing is up or not—using the following script:
VOLATILITYSWINGS(ATRS=4.00)IsUp
The second column shows the current swing count:
VOLATILITYSWINGS(ATRS=4.00).BarLabels
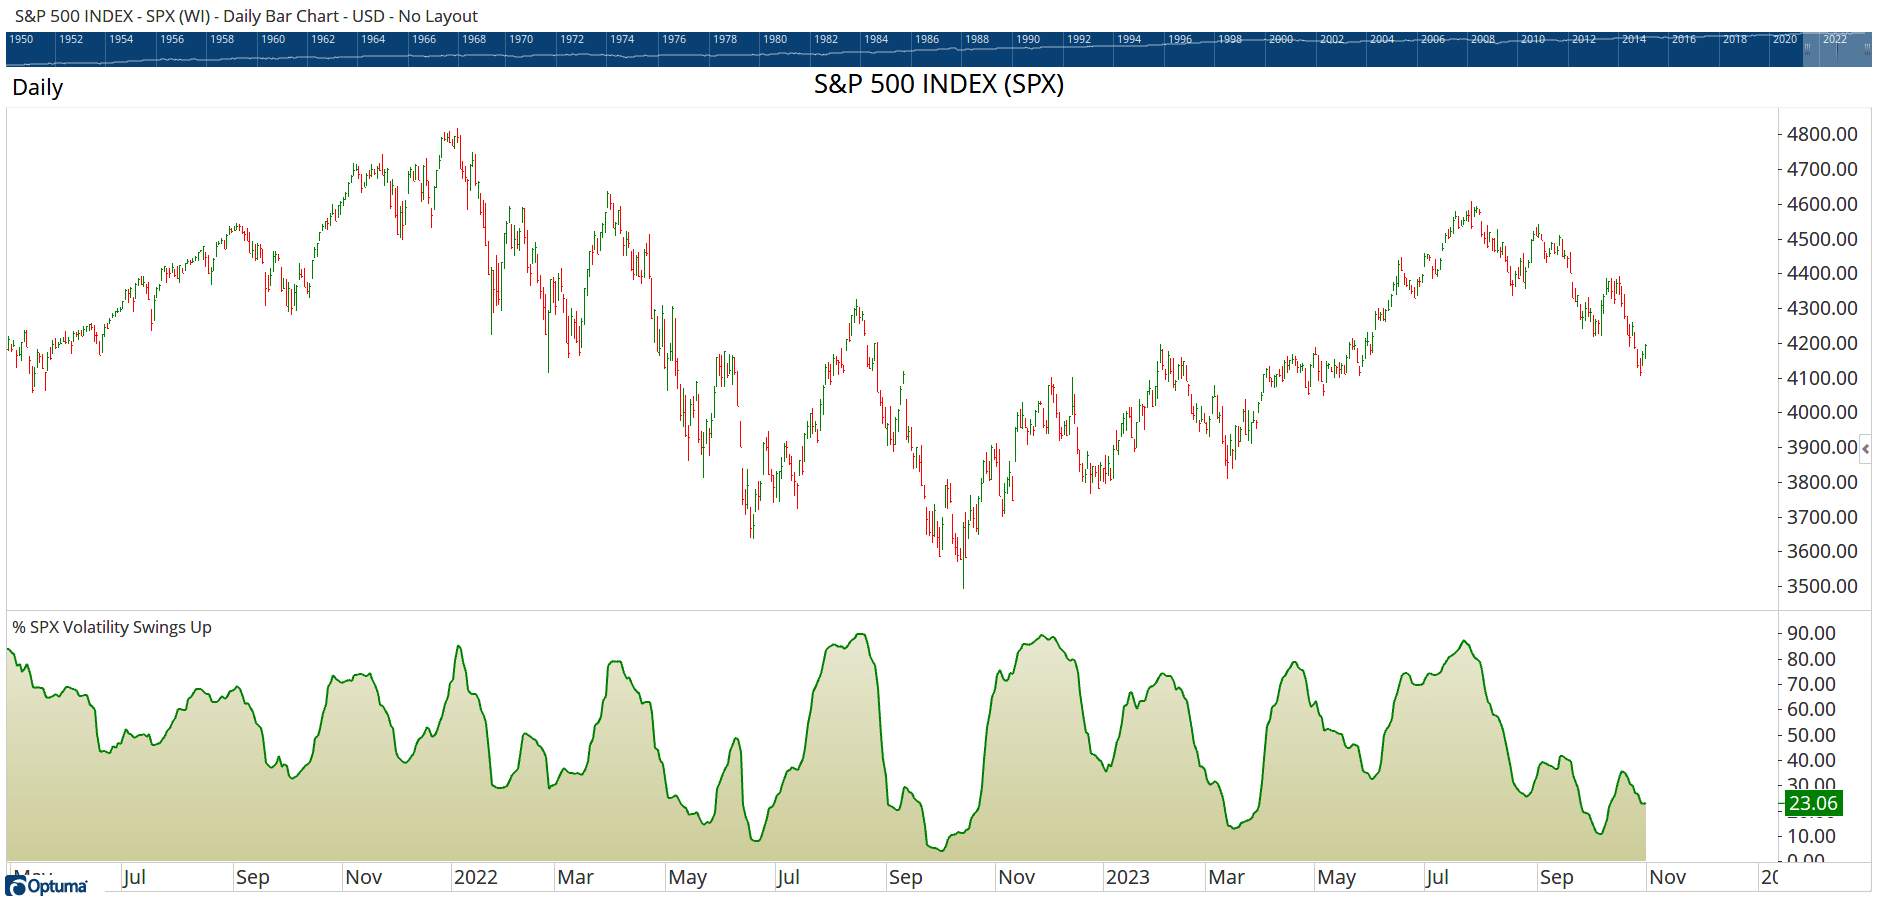
We could even use them as an ingredient in a Market Breadth measure. That is, how many stocks in the S&P500 have Volatility Swings that are heading up? Here we have the S&P500 chart with the percent of those stocks with a Volatility Swing pointed up in the bottom window.
You can see there are many uses for Volatility Swings, and more that we want to do with them. I still think the most important use is as a way to determine the trend of the security, taking that security’s volatility into consideration. If you’d like to try any of these out, make sure you let us know and we will help you get set up.
As a Computer Systems Engineer, Mathew started Market Analyst (now Optuma) within 18 months of completing his degree. From that point on, Mathew has made it his mission to build the very best software tools available.


