Catching a Falling Knife
So far in this series, we’ve been looking at long term general market conditions with an overall bullish se...
Scripting for swing patterns can be difficult and there are a few important nuances to be aware of. In this article Mathew explains some of the complexities involved.
We often get questions about swing chart scripting and we find that there is a lot of confusion about them. This problem really shows up when mixing swing conditions with bar-by-bar conditions. The market can be in an up swing for days and a swing chart (like a Point & Figure chart) will only post a new entry when the swing changes. But what happens if you are using an RSI value (which posts every day) and a Swing?
The issues comes down to the way the data is handled and if you understand this you will be able to avoid a lot of confusing results. Before we start, if you need a primer on Swing Charts, have a look at this Knowledge Base post and video.
OK, grab a coffee – or stimulant of choice – as this is going to go deep!
On the bar chart we see zones where the swing script is true, but that is often a drawing item that has been joined so it looks nice. The scripting engine is not seeing a value for each date in the zone - just a data point for each swing high and low.
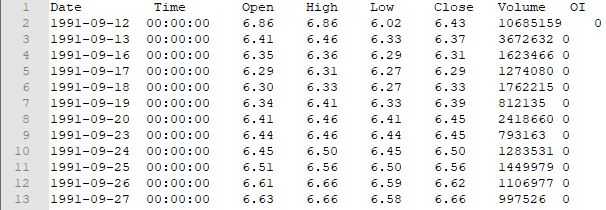
Internally, Optuma sees daily data like this:
 Bar List
When you look at the dates you can see that the data is sequential, that is there’s an entry for every day – it’s easy to work with.
Unfortunately with swings it not quite that simple as there is not a value for each day. The ‘swing list’ looks like this:
 Swing List
When you look at the dates above you will see that there are gaps between the start and end date. You will also see that it is possible to get multiple swings on the one date (usually outside bars). It is these gaps that are a nightmare to work with (not to mention the multiple swings on one day).
On a chart the drawing engine handles this swing data and stretches everything so we get nice lines joining the swing highs and lows, but in the scripting engine we don’t have the same luxury. This is because there may be a reason that we want to work with ‘swing lists’ instead of ‘bar lists’. We need to have the flexibility to be able to do both.
In scripting, when I do SwingEnd(GS1) - where GS1 is my swing variable - my result is a swing list with all the date gaps - as we saw in the table above. But when I do GS1.SwingEnd I get a bar list as that function returns the position of the swing for each day. It calculates where the swing would have been on that day, i.e. on the third day of a 10 day up swing, it will calculate where the swing high was up to on that day, and not the final swing end value.
In system testing I have to be careful which version I am using. The worst example was when I was testing Gann Swing Breadth. In that method I was counting the number of S&P 500 stocks which were in an up swing. The results were amazing! So much that I was sure that it was time to retire and live on an island somewhere. The issue I had was that the historical swings already had their ultimate end price calculated. That was when we created the GS1.SwingEnd function so that in history we would know the price the swing high was on that historical date.
So to clarify, for the purpose of testing Gann swing patterns you would need to use SwingStart() / SwingEnd() functions for searching for patterns. If you are mixing swings with other measures, it is better to use the dot notation.
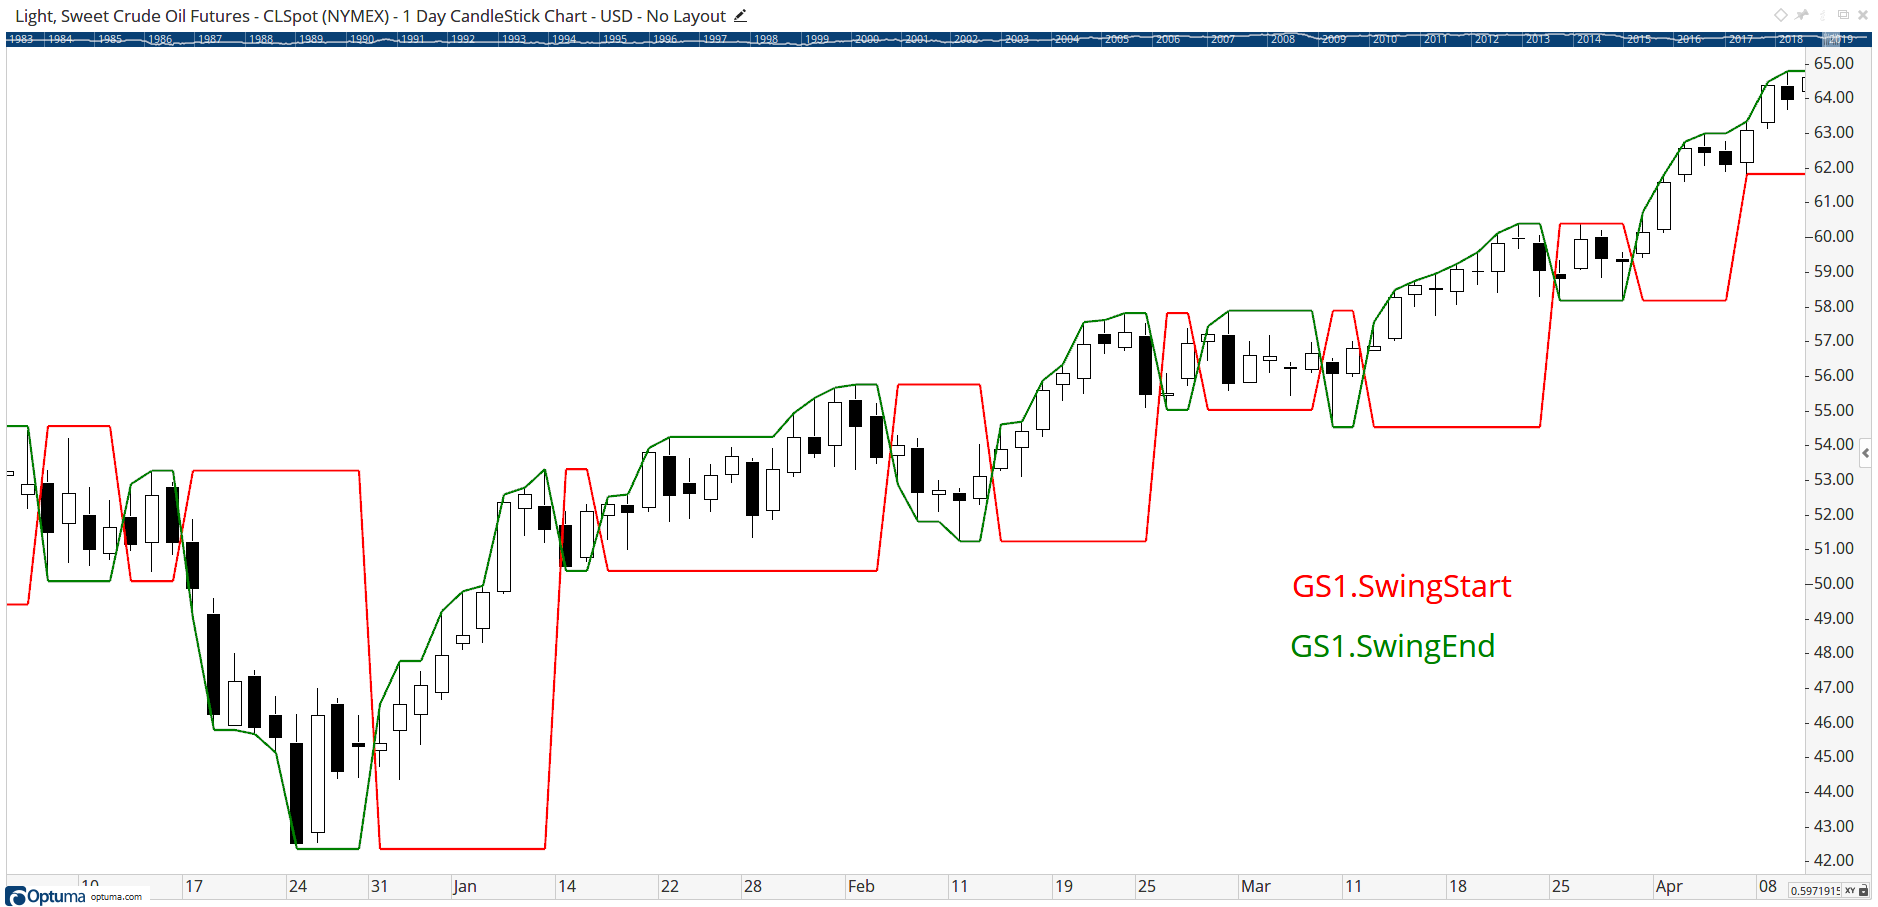
The GANNSWING() function can be used to define the swing variables, which can then be used with other functions, such as SWINGSTART, SWINGEND and SWINGUP. One very useful way to see what is being calculated is by using a Show Plot tool. The following chart shows the swing start and end values for each day, using the following script:
1
2
3
4
5
6
//Define the swing;
GS1 = GANNSWING(SWINGCOUNT=2, USEINSIDE=True, METHOD=Use Outside Bar, USECLUSTERS=False);
Plot1 = GS1.SwingStart;
Plot1.Colour = Red;
Plot2 = GS1.SwingEnd;
Plot2.Colour = Green;
 SwingStart & SwingEnd
You can see how the green line “grows” with the swing end, but the red swing start stays flat as that value never changes.
The simple hack to convert a swing list to a bar list is to add a bar list condition to the script. In the example below we’re comparing the relationship of recent swing start values. As soon as Optuma sees the c6 condition (Close() > 0), the script engine will convert the script list to a bar list. It won’t look different on the chart but will in the scanning and testing engine.
1
2
3
4
5
6
7
8
9
10
11
12
13
//Define the GannSwing variable;
GS1 = GANNSWING(SWINGCOUNT=2, USEINSIDE=True, METHOD=Use Outside Bar, USECLUSTERS=False);
//Has the current swing up been confirmed?;
c1 = SWINGUP(GS1);
//Compare SwingStart values for previous swings;
c2 = SWINGSTART(GS1,1) < SWINGSTART(GS1,3);
c3 = SWINGSTART(GS1) > SWINGSTART(GS1,2);
c4 = SWINGSTART(GS1,3) < SWINGSTART(GS1,5);
c5 = SWINGSTART(GS1,2) < SWINGSTART(GS1,4);
//Convert SwingList to BarList;
c6 = Close() > 0;
//Signal when all conditions are true;
c1 and c2 and c3 and c4 and c5 and c6
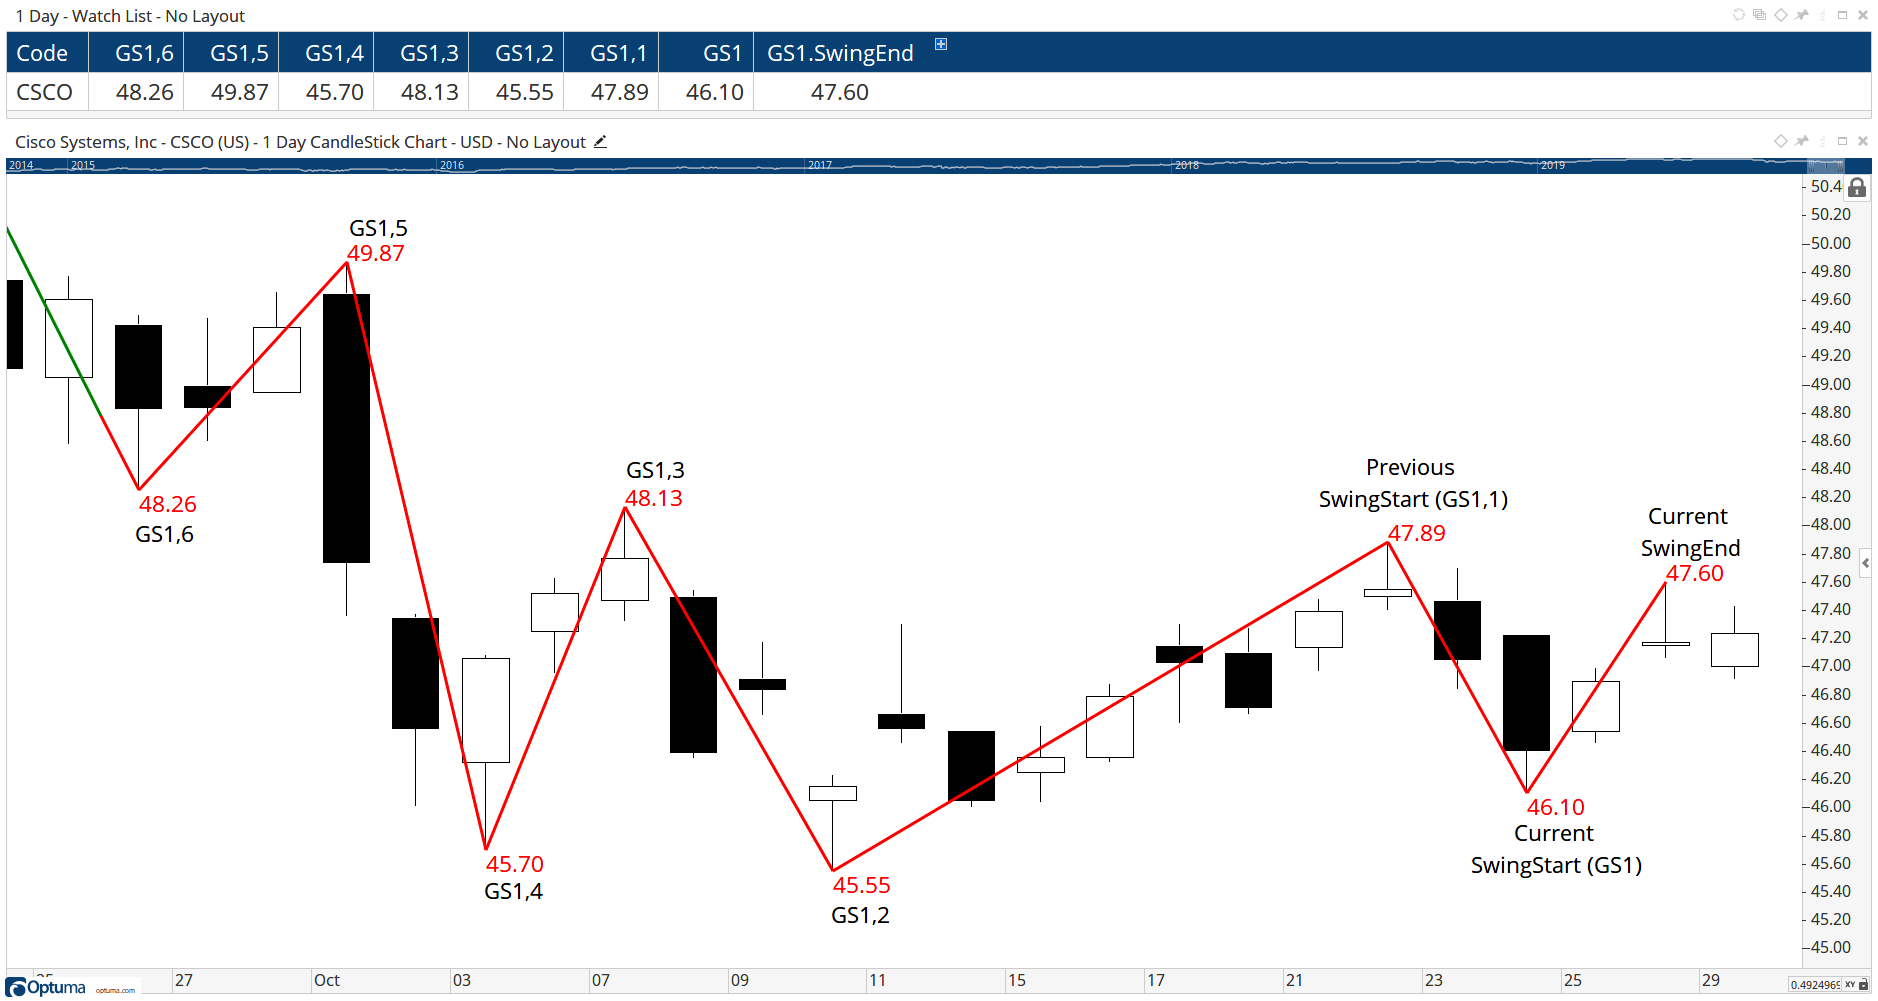
NOTE: Regarding offsets, SWINGSTART(GS1,1) is the same as SWINGSTART(GS1)[1]: both will calculate the previous swing’s starting value. Also, the current swing direction is very important! If the swing is currently up then the 1, 3, and 5 offsets are the 3 previous swing highs, and 2, 4, and 6 are the previous swing lows. If the current swing is down then it’s the opposite: the odd offset numbers are swing lows and evens are swing highs. I told you it was going to get deep!
Let’s explain that script in a bit more detail. Here’s an example of the swing values calculated in the watchlist columns, which match the labels on the swing chart overlay. The script is looking for confirmed swing up (variable c1), with a higher bottom (c3 and c5) after two lower tops (c2 and c4). When all those conditions are true then a true signal will be triggered.
 SwingStart & SwingEnd
Both have their uses. For example, GS1.SwingEnd[1] will not give me the end of the last swing, but SwingEnd(GS1)[1] will. Instead, GS1.SwingEnd[1] will give me where the swing end was yesterday.
I do feel that it would have made more sense if the two operations were flipped, but with so many people using scripts we can not make that change without blowing up a lot of people’s work. So we are stuck with it working this way.
Click the button to download a workbook with the scripts used above, and next time will look at other swing script examples, including swing trends.
Get blog updates and Optuma News
