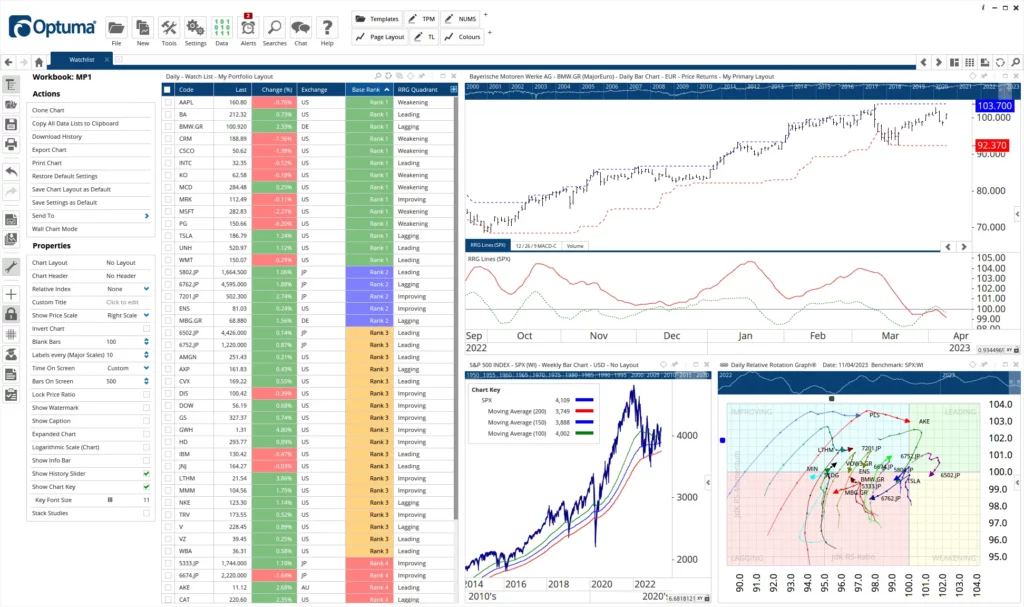
Optuma creates advanced technical analysis tools.
How we can help you…

Software Solutions
The foundation of Optuma is the highly advanced —but easy to use—software. If you are looking for a package that will give you unique insights then you need to trial the Optuma Software.

Enterprise Solutions
Optuma has worked with some of the world’s largest firms to integrate internal data (portfolios, ratings, and benchmarks) into a seamless experience. We can help your company with a custom solution.

Education
From blogs, to CMT courses, to strategy training, or even courses on getting the most out of the Optuma software, our Optuma experts are here to help you.

Gann Solutions
Optuma has the world’s most comprehensive Gann module available. If you are a student of the geometric and esoteric works of Gann, you will want to add this module into your copy of Optuma.

Web Based Solutions
Do you need a browser based chart and data solution? Optuma has produced incredible web products that can help you achieve what you need.

Consultation
Whether you need help quantitatively testing ideas, or you are looking for bespoke solutions to internal issues, Optuma has specialists and engineers who can help give you the answers you need.

RRG Solutions
Relative Rotation Graphs are one of the biggest breakthroughs in financial analysis in the 21st century. Not only are the most advanced version of these charts available in Optuma software, but Optuma also represents RRG Research in the production of custom solutions for other products. Let us know if you want to implement RRGs into your products.

Quantitative Solutions
Do you want to quantitatively test your strategies without needing to learn how to program? Optuma software can help. The Optuma quantitative tools are so fast that a 10 hour testing process can be carried out in seconds.

Publishing
When you need to communicate your ideas to your clients, you need the best publishing tools you can get. Optuma’s publishing module allows you to produce perfect charts with annotations and recommendations. Whether PDF, PowerPoint, or web publishing, Optuma takes the hard work out of publishing.
Companies that our clients work for….
What our clients say…
I’ve worked with Optuma for almost three years now. Beforehand, I used a suite of technical analysis research products to assist in my portfolio management strategies and trading. Organizing this conglomeration of research products into something that was easily utilized and actionable was not easy – and I had a plethora of spreadsheets and chaotic, clunky data saved on my server.
Signing up for a trial was intimidating, I admit. These other pieces of software I was used to were certainly inefficient, but they were user friendly and most importantly, I was comfortable with them. However, once I started to go through paid training sessions with Mathew and Darren, combined with the enormous library of instructional videos, I was positively and overwhelmingly excited about all the undiscovered research capabilities that I previous was completely unaware of.
Having a subscription to Optuma is like having a young, incredibly intelligent, malleable human mind, combined with computer processing power at your fingertips. It’s as if when you login for the very first time, a computer genius welcomes you at the door and asks, “What would you like to do?” …and, at least for me, Optuma can do virtually anything.
You can perform a multitude of back tests, signal tests, and trade tests while comparing the results over any time period you’d like, relative to any benchmark you choose. You can create seemingly complex, yet simple and time-saving workbooks for the sake of streamlining your portfolio management, research, and trading processes.
If you’re interested in intermarket analysis, you can create macro workbooks for the sake of trend determination over multiple time frames. You can even create your own custom indicators and plot them on a chart so that you can see the results visually via arrows, vertical lines, or histograms. The possibilities are endless.
I am not a computer engineer, nor do I want to be, so this was one of the most intimidating challenges I faced initially when becoming an Optuma user. The program looks similar to music and production software, if you’re familiar with Pro Tools, Final Cut, or Garage Band. Upon login, you’re faced with a blank slate and much of the advanced features are built through coding.
While this deterred me at first from moving forward, the assistance of the Optuma team, including Darren Hawkins and Matthew Humphrey was not only instrumental – they made it easy to build out my entire, streamlined portfolio management process, including workbooks for macro analysis, intermarket analysis, trade scans, inventory watch lists, exit strategies on current positions complete with custom indictors, and multi-time-frame relative rotation graph workbooks.
I can’t count the number of times I’ve been on the phone with the Optuma team using a screen share feature they utilize as they assist in writing a code for me, fixing a mistake I’ve made, or assisting in a back-test or signal test. They are phenomenally hands-on when it comes to technical support.
Bottom line, Optuma simplified my process and dramatically increased my confidence as it pertains to portfolio management and the strategies I implement with my firm. Not even six months into my subscription, I don’t know what I would ever do without it – and for all the value and tools the software provides, I strongly believe it’s underpriced.
I recommend Optuma to all the PMs, RIA’s, and financial advisers I know, and my recommendation is always the same: Sign up for a trial, allot a good 10 hours/week to learning and understanding the basics on how it works, watch the videos, and spend some time on the phone with technical support.
Write out your strategy on paper if you haven’t done so already. If you’re like me, pay the extra cost for some consulting sessions to really dive into the weeds and accelerate the learning process. Then, spend the following 3-4 months building out your paper-napkin strategy within Optuma and experience your life getting easier as your portfolio management confidence grows over time. In time, assuming it’s a good fit for the role you play at your firm, you’ll never look back.
“Please excuse my language, but holy crap, Optuma continues to blow me away.
Difficult time stringing words together but feature after feature astounds me… i.e., the ability to highlight numerous tools/lines/etc and make it a quick button up top is crazy.
Multi time frame analysis with different periods/averages on the same chart… multi currency – wow.
Flexibility to deal with multiple markets at the same time…. you guys don’t need to give me more reasons to love this thing!”
I have been using Optuma for around 18 years now both as an government accredited educator, and as a professional fund manager and private trader. As an educator, Optuma makes my job very easy as it has inbuilt tools that help me develop content and teach. It is also simple enough for beginners to use, yet is powerful enough to allow them to develop their skills and knowledge to a high level.
As a fund manager and trader, I need a consistently reliable tool that can not only do the simple things such as trend analysis but allow me to undertake advanced analysis in market timing and other advanced theories, which Optuma does with ease. I also need to collaborate with other analysts, create presentations and many other things in my role, and it seems that no matter what road I chose to take my analysis down or what my needs are Optuma already has what I need before I even know I need it.
I’ve been using Optuma for nearly 2 years and I chose it as my TA platform because of the company’s dedication to creating the best possible experience for the end user. It’s a platform that really caters to technicians and the company is constantly looking for ways to improve it.
I like Optuma because it’s user friendly, while giving you various tools to work with. It makes it easy for me to organize my work and has allowed me to produce more in less time. The efficiency of report production is remarkable.
I’m able to use Market Analyst on all of my computers, anywhere, any time. I can link market data from various sources or work offline.
Finally, the support staff are friendly, responsive and knowledgeable when I need help with the platform.
Technicals are all about visualizing data and Optuma clearly has the most advanced graphics of all technical platforms. The use of “layers” allows a user to organize and manipulate data in ways that are impossible with other software programs. I use this product every day to help manage various portfolios and I encourage everyone to try it out.
I spent a few years navigating the maze of online brokers and software providers looking for a charting platform that was comprehensive, efficient, precise, and user friendly. What I learned was that presenting charts with some technical tools and indicators is not the same as offering charting software! I tried Optuma as part of their offering for CMT candidates, and I quickly learned the difference between retail solutions and professional software designed by technicians, for technicians. For practitioners, CMTs, or those who trade professionally, I can’t imagine using another platform. As someone who has tried them all, there is really nothing comparable.
Latest Posts from our Blog….
S&P Indices – March 2023 Quarterly Rebalancing
Details on the latest quarterly rebalance of the S&P indices for the ASX & US.
Is 2023 shaping up to become the year of A.I.?
Matthew Humphreys looks at the rise of Artificial Intelligence and how it could impact investing – and Optuma.
Introducing GoNoGo: Avoiding Analysis Paralysis
Introducing the GoNoGo indicators: eliminate analysis paralysis to keep your focus on price, without losing sight of the complete technical picture.
Scripting and Anchored VWAPs
Learn how to create scans and tools based on the Anchored Volume-Weighted Average Price (AVWAP) tool.
Optuma on the Cloud
In this week’s blog article Matthew Humphreys discusses the do’s and don’ts when using Optuma with the cloud.
Pressure is on the January Barometer
What is the January Baromoter? Does it even work? In this post we’ll roll up our sleeves and have a look.
Blog Sign Up
Sign up to our blog and get email updates when we post new content. Blog posts are designed to be a mix of market commentary, financial research & Optuma tips & tricks. We don’t post often, but our posts help anyone who is interested in advanced Technical Analysis.